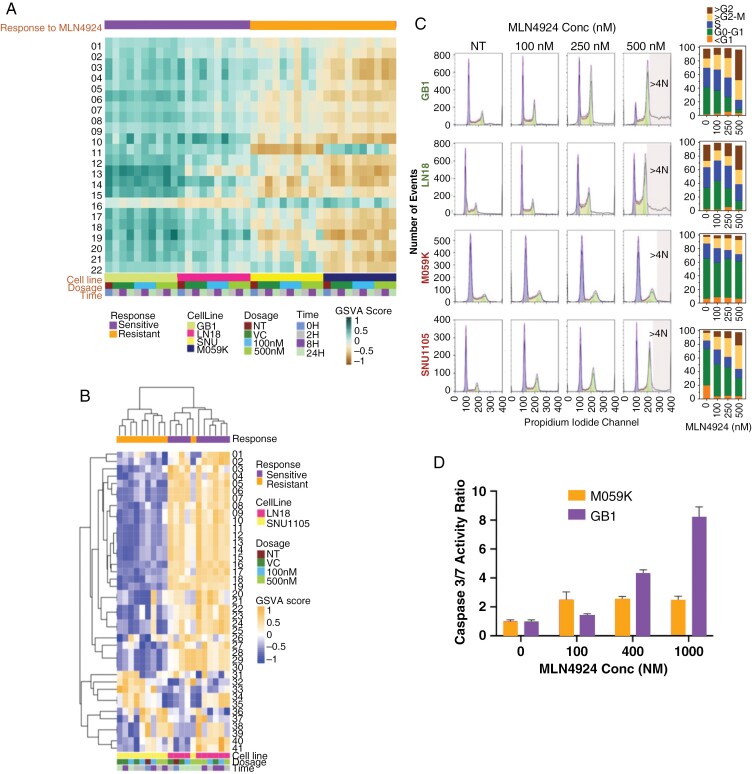
Figure 2.
DNA replication processes and cell cycle dynamics distinguish glioma cells sensitive and resistant to MLN4924. Analytes from sensitive (LN18 and GB1) and resistant (M059K and SNU1105) glioma cells were collected at 0-, 2-, 8-, and 24 hours post-exposure to 0 (vehicle control), 100 or 500 nM MLN4924 and analyzed by next-generation RNA sequencing and mass spectrometry (LN18 and SN1105 only). (A) Supervised gene set enrichment analysis of RNA Seq data was carried out with 22 gene sets that were significantly differentially enriched between sensitive and resistant models (P < .05, t-test with multiple testing corrections) (Gene set names in Supplementary Table. Fig 2). (B) Hierarchical clustering of protein sets that differentiate sensitive and resistant samples highlights replication and repair pathways. (C). Sensitive (LN18 and GB1) and resistant (M059K and SNU1105) cell lines were treated with DMSO (NT) or MLN4924 (100, 250, or 500 nM) for 48 hours in triplicates and analyzed for cell-cycle distribution and percentage. (D) MLN4924 induced apoptosis (Caspase-Glo 3/7 Assay) in GB1 (sensitive) but far less so in M059K (resistant) glioma cells; levels of caspase-3/7 were normalized to those of the DMSO-treated controls.

