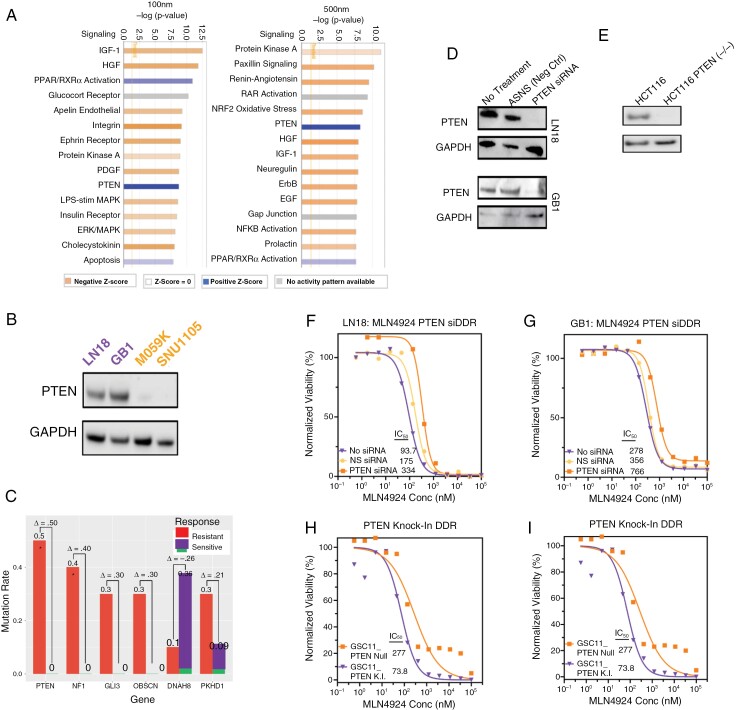
Figure 3.
PTEN loss decreases sensitivity to MLN4924. (A) Unbiased ingenuity pathway analysis of RNA Seq data identified the most differentially deregulated pathways following MLN4924 treatment between sensitive and resistant models. (B) Protein expression of PTEN determined by IB analysis. (C) Differential mutation frequencies of selected genes in a glioma cell line panel sensitive (n = 11) and resistant (n = 10) to MLN4924 (21 cell lines total; median analysis). (D) Protein lysates from the treatment naïve cell line (LN18 and GB1) were IB probed for PTEN expression and (E) a PTEN isogenic pair (PTEN WT and PTEN knock-out [PTEN K.O.]) of colorectal cancer cell line HCT116. (F-G) Viability of LN18 and GB1 ± siRNA PTEN knockdown following MLN4924 treatment. (H) Viability of HCT116 (PTEN WT and PTEN knock-out [PTEN K.O.]) after treatment with MLN4924. (I) Viability of a PTEN isogenic pair (PTEN null and PTEN knock-in [PTEN K.I.]) of glioma stem cell line model GSC11 after MLN4924 treatment. F-I Plots show results from 5 replicates and P-values for Nonlinear regression fit comparison of curves are < .001.

