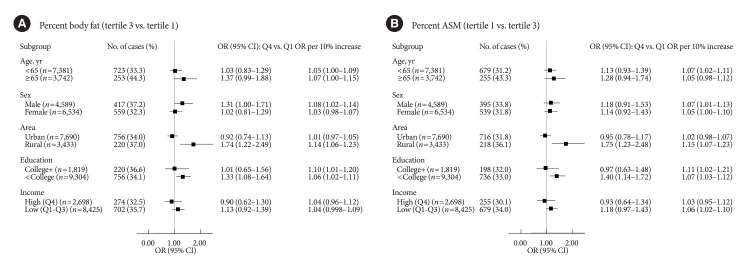
Fig. 2.
Associations of ultra-processed food (UPF) intake with percent body fat defined adiposity (A) and low skeletal muscle mass (B) by subgroups. Associations of ultra-processed food (UPF) intake with percent body fat defined adiposity and low skeletal muscle mass by subgroups. Multinomial logistic regression models were used to estimate odds ratios (ORs) and their corresponding 95% confidence intervals (CIs) for the tertile (T) 3 of percent body fat and the T1 of percent ASM comparing quartile (Q) 4 to Q1 of UPF intake as the exposure variables (T3 of percent body fat: ≥24.5% for male, ≥36.0% for female; T1 of percent ASM: <30.7% for male, <24.1% for female). P for trends was determined by treating the median value of UPF intake as a continuous variable using multinomial logistic regression models. A 10% increase in UPF intake was used to estimate ORs for higher adiposity or lower appendicular skeletal muscle mass (ASM). A multivariable-adjusted model was adjusted for age, sex, residential area, education level, monthly household income level, marital status, current smoking, current drinking, walking exercise, weight training, and total energy intake, except the corresponding subgroup variates.

