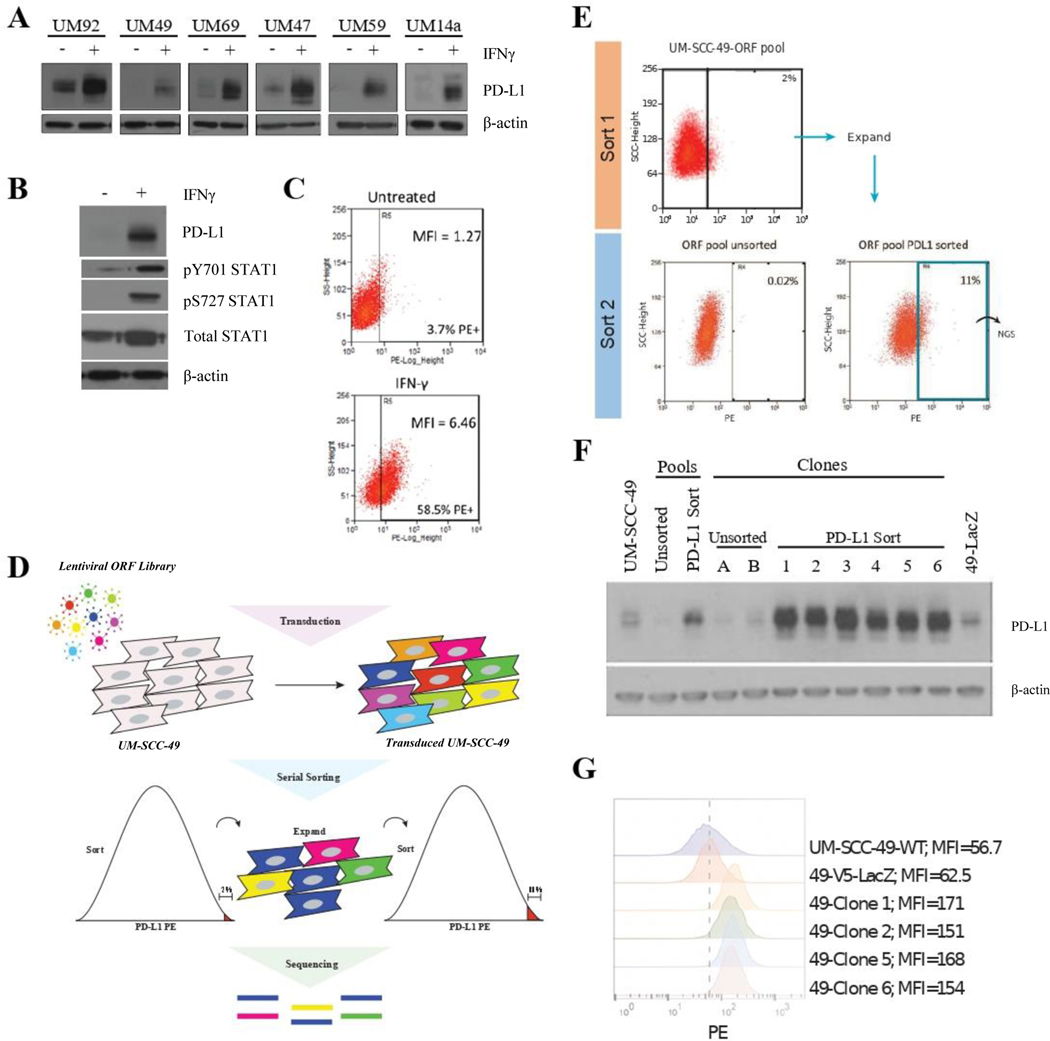
Figure 1. Genome-Wide ORF Screen to Identify Drivers of PD-L1 Expression in UM-SCC-49.
A, Individual cell lines were treated with 10 ng/mL IFNγ (or vehicle control) for 72 hours, followed by protein harvest and immunoblot for PD-L1. B, UM-SCC-49 cells were treated with 10 ng/mL IFNγ for 72 hours, followed by protein harvest and immunoblot for PD-L1, phosphorylated STAT1, and total STAT1. C, UM-SCC-49 cells were treated with 10 ng/mL IFNγ (or vehicle control) for 72 hours, trypsinized, and stained for flow cytometric analysis of cell surface PD-L1; MFI, mean fluorescence intensity. D, Schematic of genome-wide ORF library transduction. UM-SCC-49 cells were transduced with the 17,000 gene ORF library at an MOI of 0.3 followed by puromycin selection. Cells were then serially sorted for the top 2.0 % of PD-L1 expressing cells, followed by expansion and a subsequent sort for the top 11.0 %, of PD-L1 expressing cells in the population. PCR-amplified barcodes from the genomic DNA of PD-L1 sorted and unsorted cell populations were then sequenced on an Illumina MiSEQ platform. E, UM-SCC-49 ORF library cells were stained for cell surface expression of PD-L1 and the top 2.0 % of cells with highest PE positivity were selected and expanded in culture (top). This selected population was subjected to a second sort, this time with the top 11.0 % collected for next-generation sequencing (NGS) (bottom right). The initial ORF pool was also analyzed for PD-L1 expression for comparison (bottom left). F, PD-L1 western blot confirmed differential expression in all sorted clones relative to unsorted pools and clones. G, Subset of clones from (E) were stained for PD-L1 and analyzed by flow cytometry. Dashed line represents MFI for UM-SCC-49-LacZ-V5.

