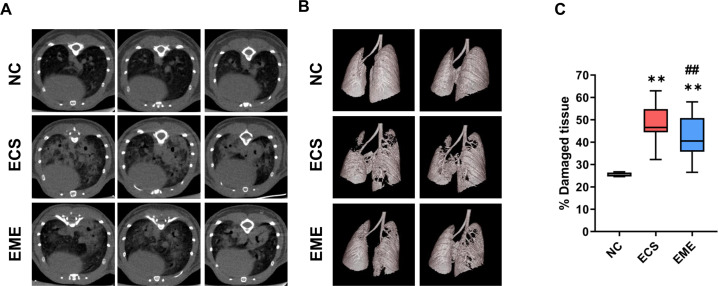
Fig. 8.
Computerized tomography (CT) scans of mice lungs. (A) The air-filled areas in the mice lung CT scans appeared as dark backgrounds, while the lesions resulting from the E. coli administration were observed as hyperintense patches. (B) Semi-automated 3D rendered image of the mouse lung parenchyma and airways. The white region represents the aerated parenchyma, allowing visualization of retained parenchyma. (C) Calculated percent of damaged lung using CT images from Fig. 8A. n = 4, 23, and 21 in the NC, ECS, and EME groups, respectively. Data are represented as a box and whisker plot. Whiskers represent the min and max. **, p < 0.01 vs. NC; ##, p < 0.01 vs. ECS. One-way ANOVA post hoc Tukey analysis was used. NC, normal control; ECS, E. coli-induced ALI control group; EME, thMSC-EVs treatment group after E. coli-induced ALI

