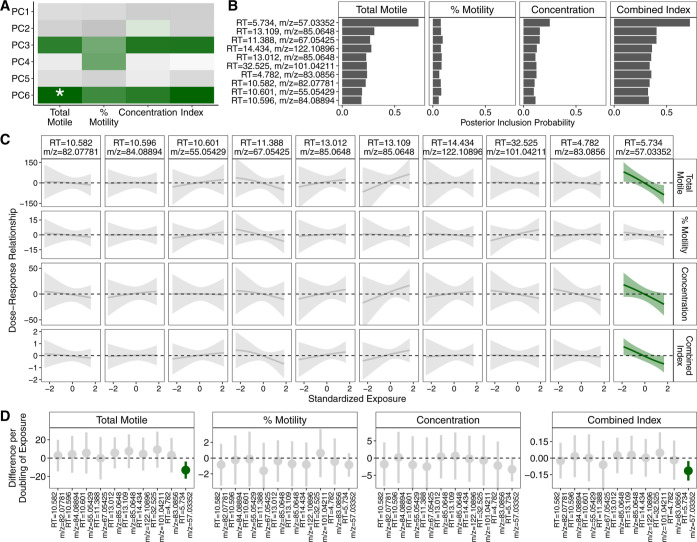
Figure 3.
Machine learning pattern recognition based approach identified a spectral peak to be negatively associated with worse semen parameters. (A) Heat plot of results PC regression. Green indicates negative association and the asterisk denotes statistical significance after Bonferroni correction. (B) Bar graph of posterior inclusion probability calculated from BKMR. (C) Estimated dose-response plots and associated 95% credible intervals from BKMR. Green line and credible interval indicates that the credible interval deviates from the null. (D) Forest plot of estimates and associated 95% confidence intervals from standard single-exposure linear regression models.

