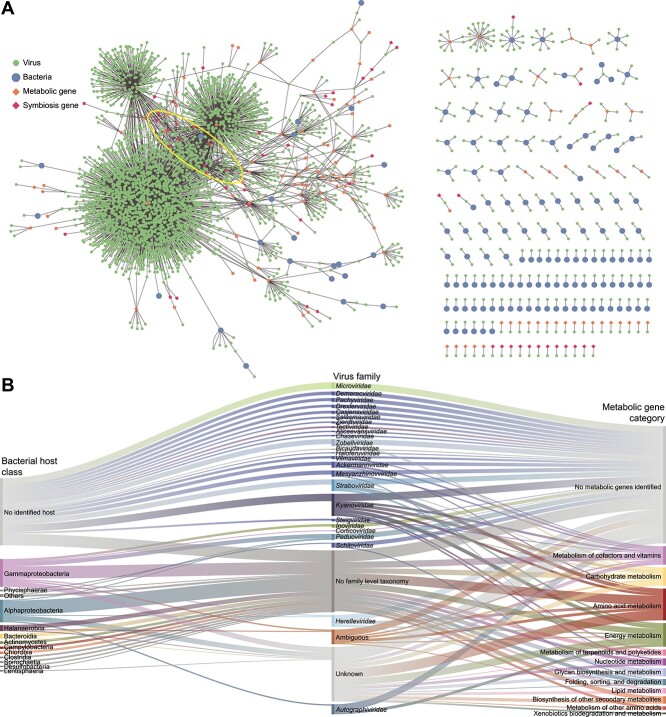
Figure 6.
Bacteria–phage–gene network. (A) GCVDB viruses were connected to bacterial hosts (isolate and bMAG) according to the host prediction described in the methods and to metabolic and symbiosis genes according to their functional annotations. The ellipse indicates the position of viruses identified as keystones in the network analyses. (B) Alluvial plot displays abundant bacterial classes (left) linked to viral families (center) found to interact with them though CRISPR spacer and provirus linkages identified in this study. On the right, viral families are linked to metabolic genes encoded in their genomes.

