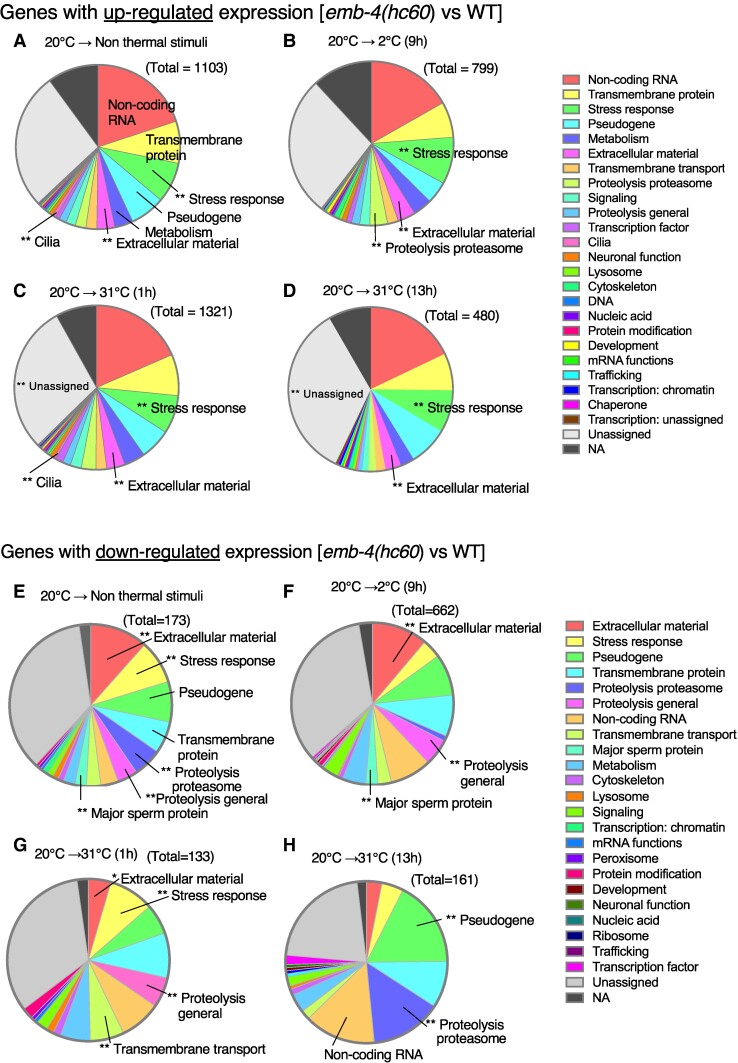
Fig. 2.
Genes whose expression was up- or down-regulated by the loss of emb-4. RNA-Seq analysis identified differentially expressed genes in emb-4(hc60) mutant compared with wild-type adult worms using DESeq2. Genes were classified as upregulated by log2FC > 1 and FDR P-value of <0.05, and genes were classified as down-regulated by log2FC < -1 and FDR P-value of <0.05. Gene ontology enrichment analyses were performed in WormCat (52). Triple replicates of total RNA samples were analyzed per genotype and temperature condition. Temperature conditions used were 20°C-grown (A, E), 20°C-grown and then incubation at 2°C for 9 h (B, F), 20°C-grown and then incubation at 31°C for 1 h (C, G), and 20°C-grown and then incubation at 31°C for 13 h (D, H). The total in the figure is the number of upregulated or down-regulated genes of each comparison. Gene ontology categories are indicated with the color key in the right panel. The number of genes enriched in individual GO terms analyzed by Wormcat 2.0 are listed in the Data S1 Up_rgs_categories.xlsx and Data S2 Down_rgs_categories.xlsx.

