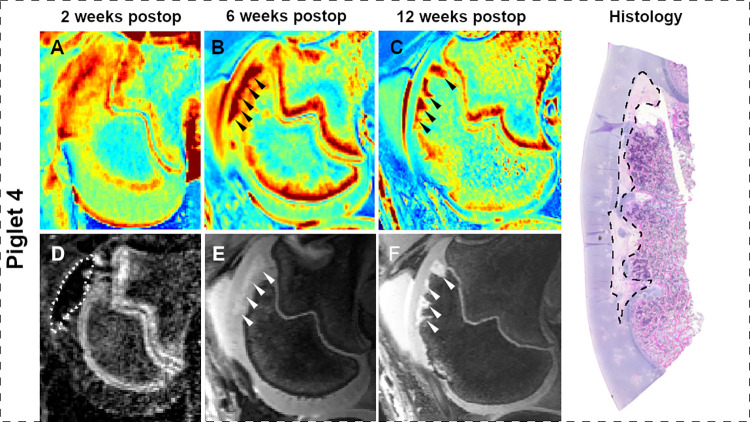
Fig 3.
T2 cartilage maps (A-C), subtracted CE-MRI image (D), and 3D DESS images (E and F) obtained 2, 6, and 12 weeks after complete devascularization of the lateral trochlear ridge in piglet 4. Dotted line in the subtracted CE-MRI image (D) marks the extent of hypoperfusion. Arrowheads identify a large OC-latens (B and E) and a subsequent OC-manifesta (C and F) lesion. Photomicrograph shows the histologic appearance of a large OC-manifesta lesion (dashed line) at 12 weeks postoperatively.

