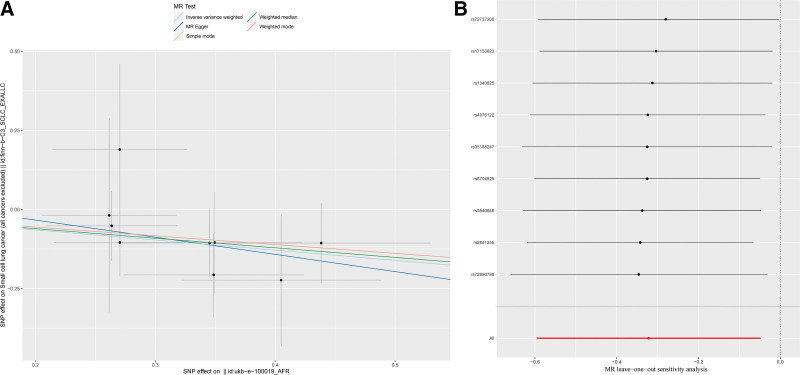
Figure 2.
(A) Scatter plot of SNPs associated with diet-derived antioxidants and risk of SCLC. The plot shows the SNP effects on diet-derived antioxidants (x-axis, SD units) as well as SCLC (y-axis, OR) with 95% CI. The MR regression slopes of the lines represent the causal estimates using 5 approaches (IVW, MR-Egger, weighted median, simple mode, and weighted mode); (B) diagram of the leave-one-out method of SNPs associated with dietary antioxidants and SCLC. Each black point indicates the log OR for SCLC per standard deviation increase in dietary antioxidants, generated utilizing each dietary antioxidants -associated SNP as an instrument. The horizontal line denotes 95% CIs of the estimates. The red point shows the combined causal estimates utilizing all SNPs as an instrument based on leave-one-out method. IVW = inverse-variance weighted, MR = Mendelian randomization, OR = odds ratio, SCLC = small-cell lung cancer, SNPs = single nucleotide polymorphisms.

