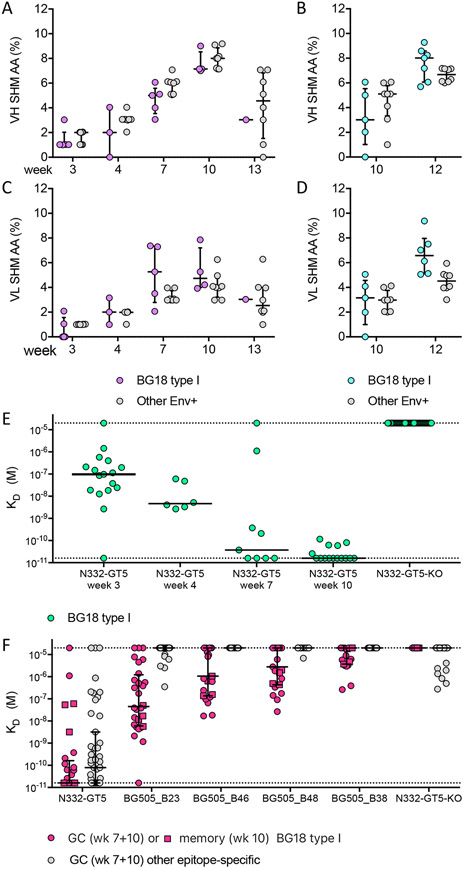
Fig. 3. Affinity maturation of BG18 type I and other N332-GT5-elicited antibodies.
(A) SHM of VH genes in BG18 type I and other Env+ sequences from GC B cells. (B) SHM of VH genes in BG18 type I and other Env+ sequences from memory B cells. (C) SHM of VL genes in BG18 type I and other Env+ sequences from GC B cells. (D) SHM of VL genes in BG18 type I and other Env+ sequences from memory B cells. For (A-D), each dot represents the median SHM for one animal, and lines indicate the median of the medians +/− interquartile range for all animals. (E) SPR KDs for BG18 type I Fabs isolated at weeks 3, 4, 7 and 10 post prime from GC B cells binding to N332-GT5 or N332-GT5-KO. The dotted line at 2 x10⁻⁵ M indicates no binding at the highest concentration tested. The dotted line at 1.6x10⁻¹¹ M represents the approximate upper affinity limit of the instrument. Lines indicate the median with interquartile range. Each data point is representative of 1 to 4 technical replicates. (F) SPR KDs for BG18 type I Fabs compared to other epitope-specific Fabs binding to a panel of boost candidates that are more similar to a native trimer than N332-GT5. Data points represent 1 technical replicate. The dotted line at 2 x10⁻⁵ M indicates no binding at the highest concentration tested. The dotted line at 1.6x10⁻¹¹ M represents the approximate upper affinity limit of the instrument.

