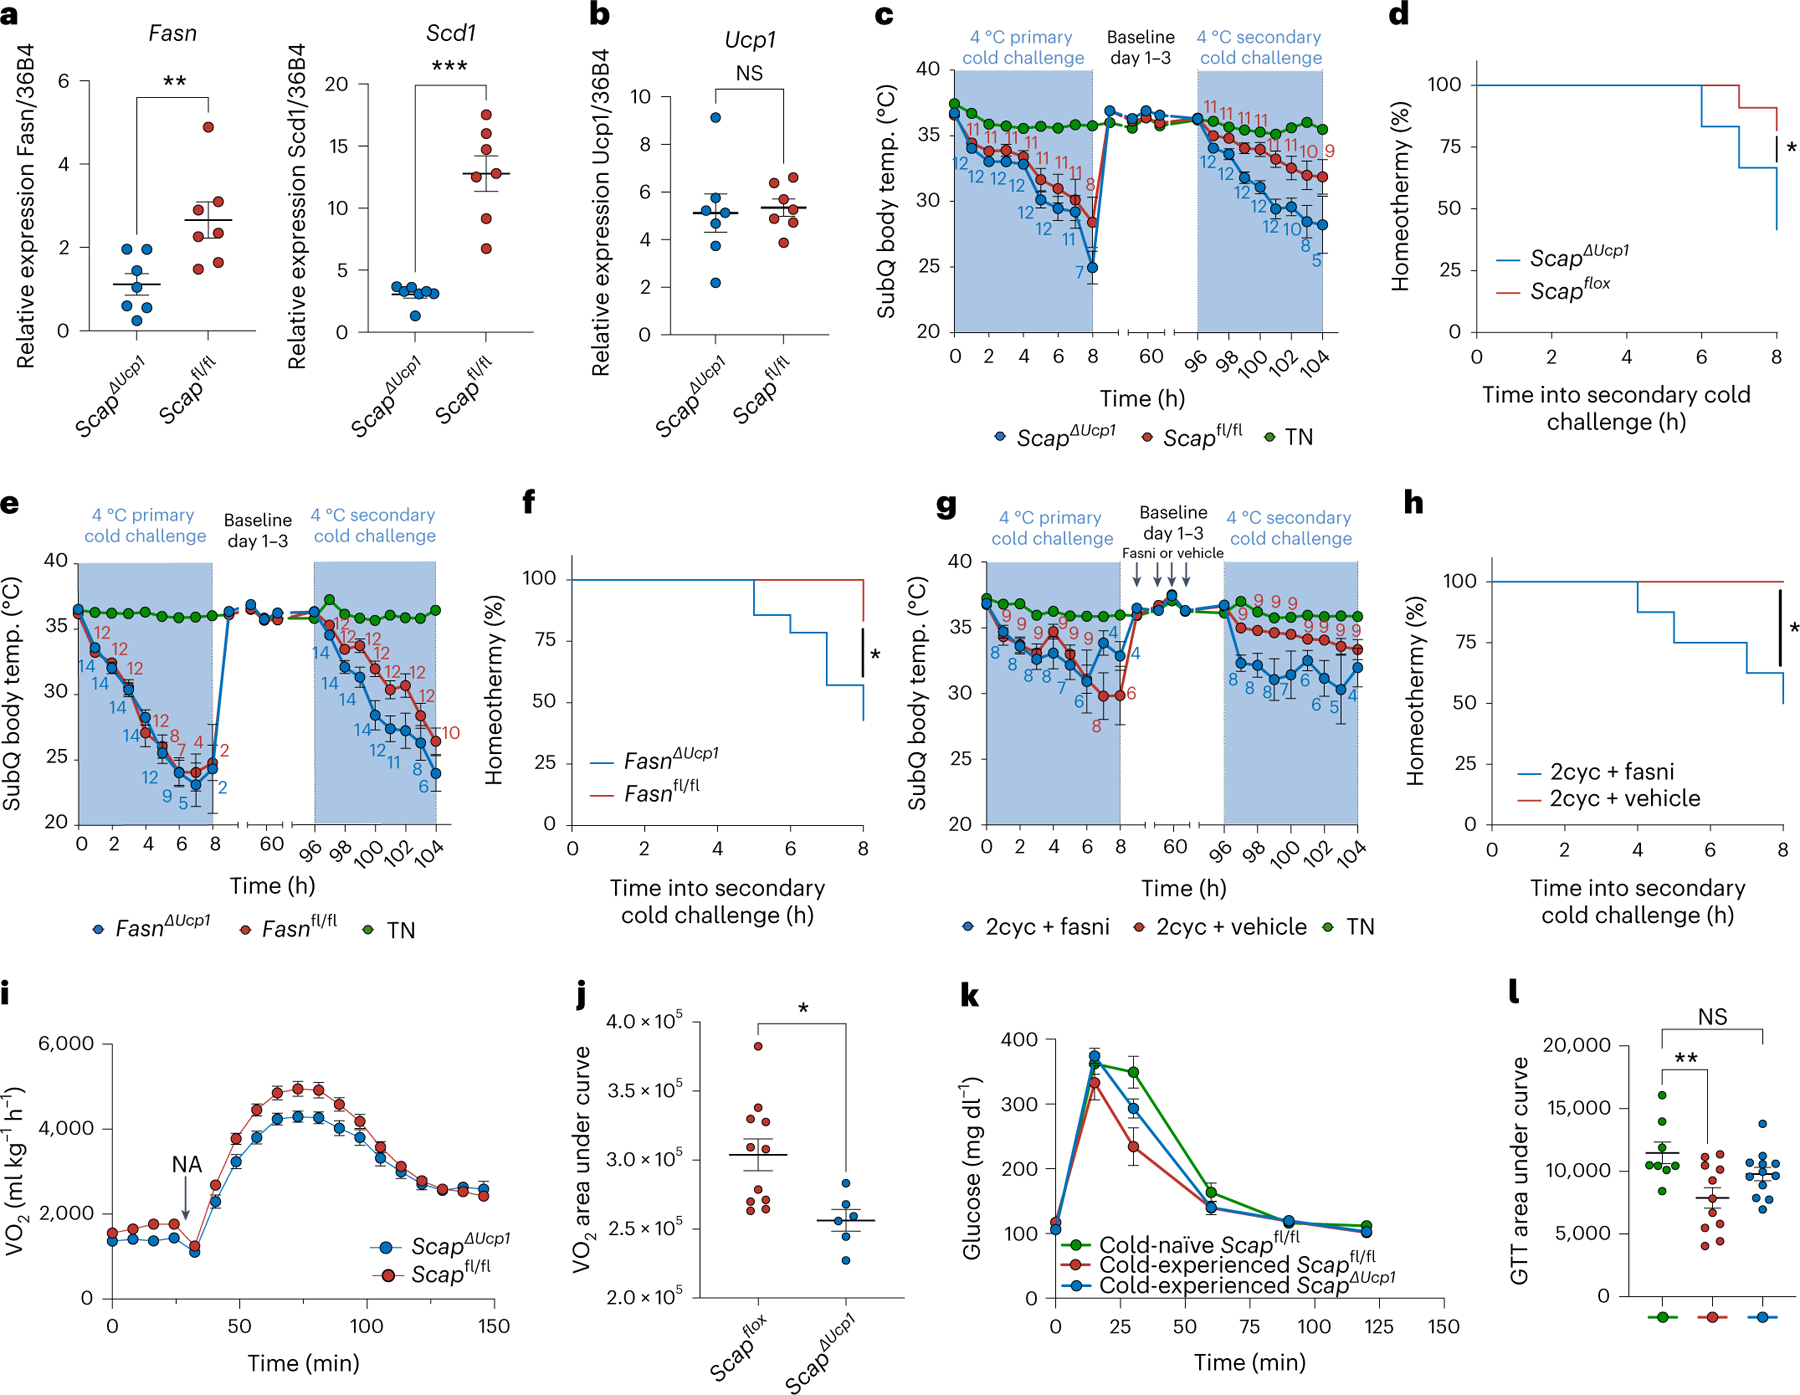
Fig. 3 |. Lipogenic brown adipocytes promote the improved secondary thermogenic response to acute cold.

a,b, Relative gene expression of Fasn and Scd1 (a) and Ucp1 (b) in BAT from ScapΔUcp1 and Scapfl/fl mice 4 d after transient primary cold exposure (n = 7 independent animals for each condition). c,d, Effect of Scap ablation in brown adipocytes on a primary and secondary thermogenic response to acute cold interleaved with thermoneutral housing for 4 d between primary and secondary acute cold exposure (n = 12 for ScapΔUcp1, n = 11 for Scapfl/fl, n = 5 for TN). e,f, Effect of Fasn ablation in brown adipocytes on a primary and secondary thermogenic response to acute cold interleaved with thermoneutral housing for 4 d between primary and secondary acute cold exposure (n = 14 for FasnΔUcp1, n = 12 for Fasnfl/fl, n = 5 for TN). g,h, Effect of pharmacological inhibition of Fasn after a primary thermogenic response on a secondary thermogenic response to acute cold interleaved with thermoneutral housing for 4 d between primary and secondary acute cold exposure (n = 8 for 2cyc + Fasn inhibition (Fasni), n = 9 for 2cyc + vehicle, n = 4 for TN). Data in c, e and g show subcutaneous body temperature during cold exposure. Animals with subcutaneous body temperature below 20 °C were removed from cold. Counts indicate the numbers of animals analysed at each time point. Data in d, f and h show the percentage of animals maintaining subcutaneous body temperature above 20 °C in the secondary cold response. i,j, Oxygen consumption rates of anaesthetized ScapΔUcp1 (n = 6) and Scapfl/fl (n = 11) mice after injection of noradrenaline (NA) (i), with calculated area under the curve (j). k,l, Blood glucose during glucose tolerance test (GTT) of ScapΔUcp1 mice (n = 11) and Scapfl/fl mice (n = 10) 4 d after primary thermogenic challenge, including cold-naive mice housed at thermoneutrality (n = 8; k), with calculated area under the curve (l). Error bars indicate means ± s.e.m. *P < 0.05; **P < 0.01; ***P < 0.001.
