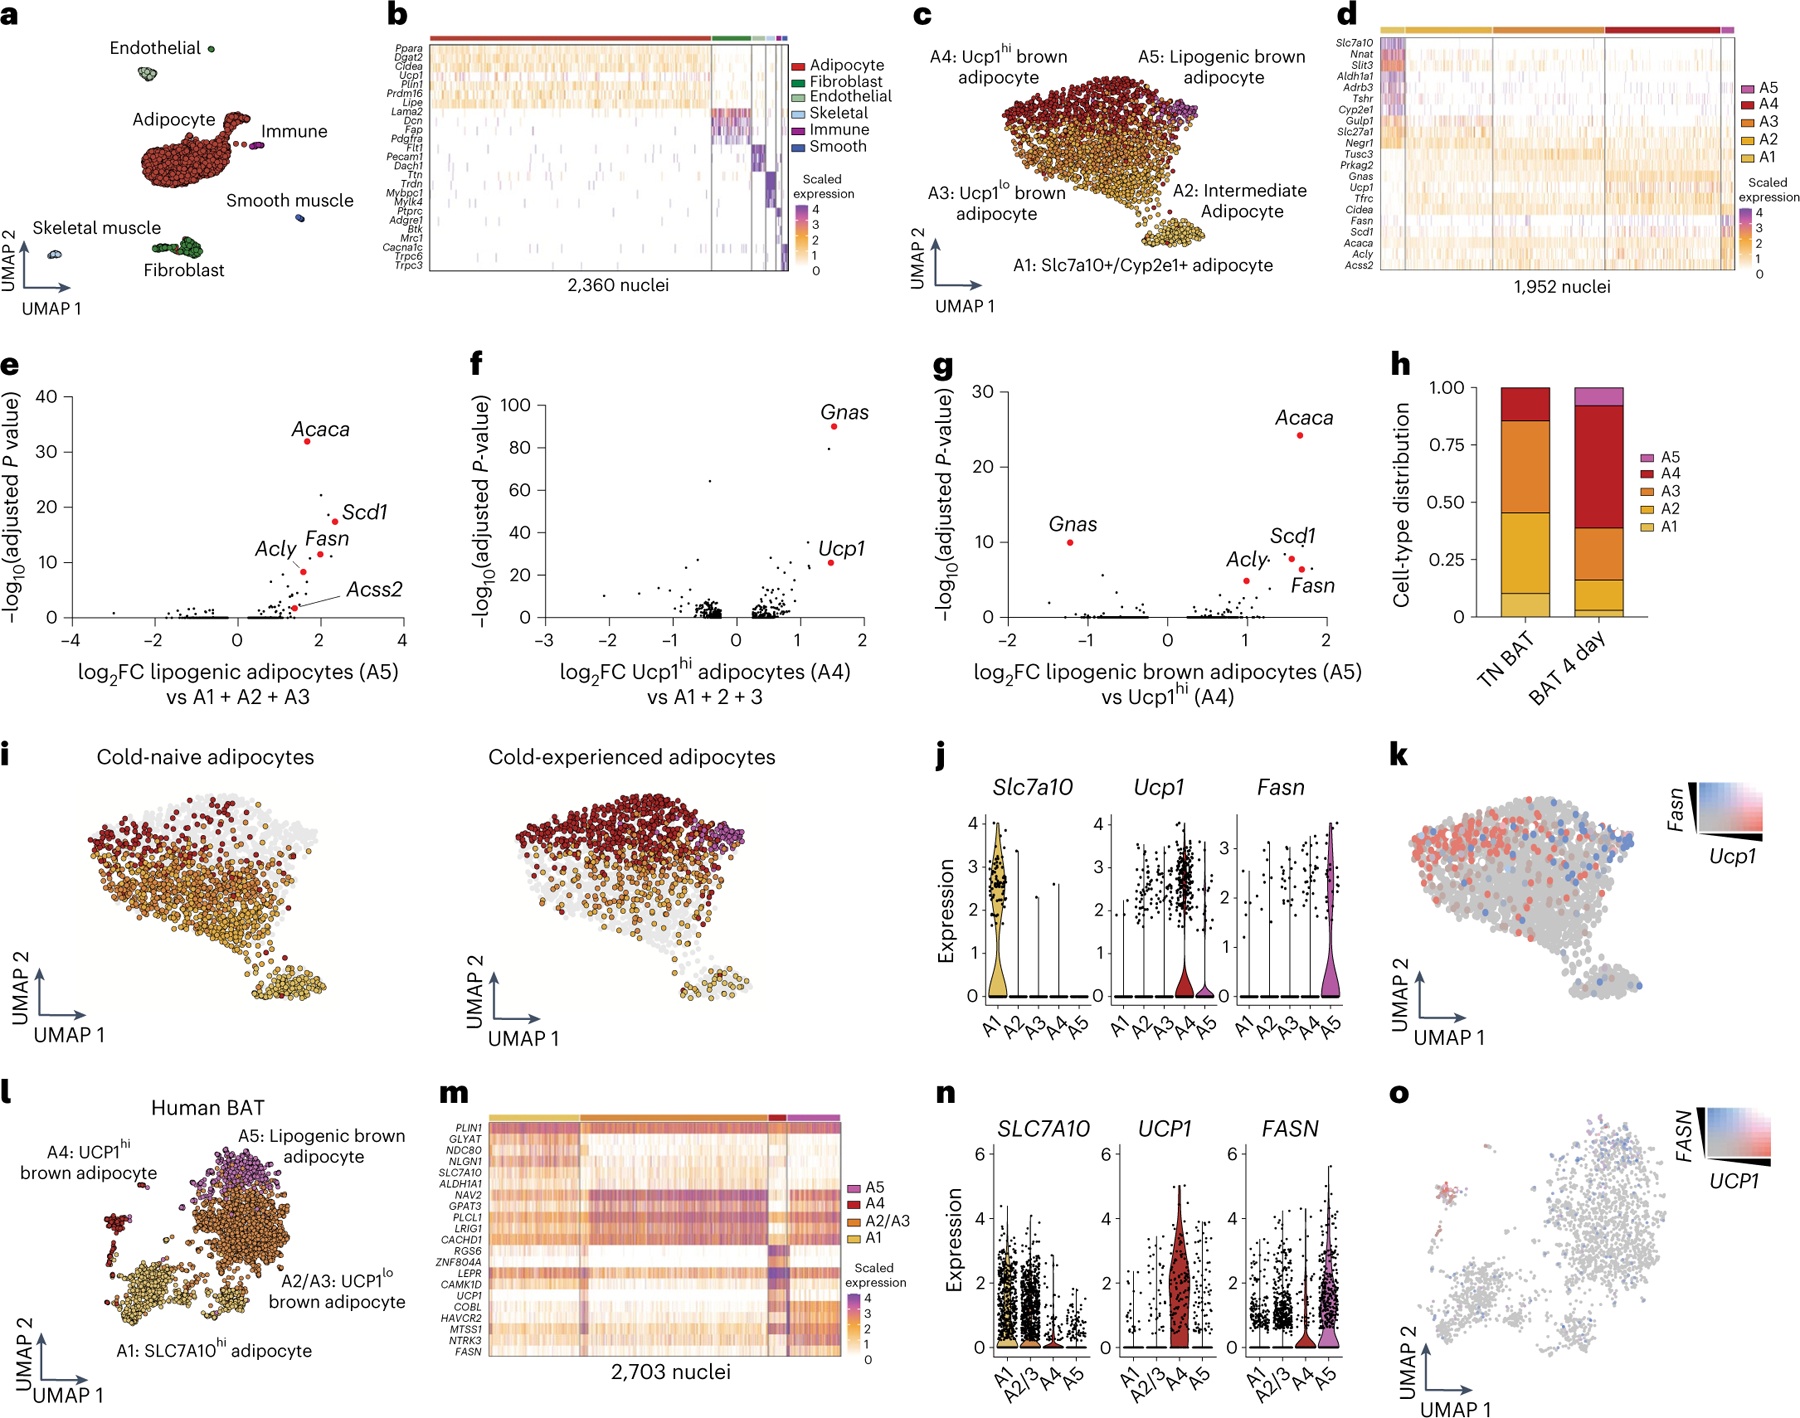
Fig. 4 |. A primary thermogenic response induces a subpopulation of lipogenic brown adipocytes.

a, Uniform manifold approximation and projection (UMAP) embedding of 2,360 single nuclei isolated from BAT of cold-experienced mice and cold-naïve mice housed at thermoneutrality. Six cell types are labelled based on canonical candidate markers. b, Heat map of top genes expressed in each cell type revealed by snRNA-seq of BAT. c, Unsupervised clustering of only the adipocyte population in BAT yielded five subpopulations (A1, Slc7a10+/Cyp2e1+; A2, intermediate adipocyte; A3, Ucp1lo brown adipocyte; A4, Ucp1hi brown adipocyte; A5, lipogenic brown adipocyte) across both thermoneutral and cold-experienced conditions based on gene expression. d, Heat map of gene expression in each nucleus across the five subpopulations of adipocytes identified in BAT. e–g, Differentially expressed genes represented as volcano plots between: lipogenic brown adipocytes and subpopulations A1–A3 (e), Ucp1hi adipocytes and subpopulations A1–A3 (f) and lipogenic brown adipocytes and Ucp1hi (g). h, Cell-type distributions by adipocyte subpopulation A1–A5 in different conditions. i, UMAP plots of the adipocytes separated by cold-naïve and cold-experienced conditions. j, Violin plots for relative expression of Slc7a10, Ucp1 and Fasn across the identified subpopulations of adipocytes in mouse BAT. k, Feature plot for Fasn and Ucp1 expression within the adipocyte population. l–o, snRNA-seq of human deep-neck BAT. l, UMAP embedding and unsupervised clustering of 2,703 adipocyte nuclei from human BAT. Within the adipocyte subset, four subpopulations were identified that resembled the subpopulations identified in mouse BAT (A1, SLC7A10+; A2/A3, UCP1lo brown adipocyte; A4, UCP1hi brown adipocyte; A5, lipogenic brown adipocyte. m, Heat map with representative gene expression across the four subpopulations of adipocytes in human BAT. n, Violin plots for relative expression of SLC7A10, UCP1 and FASN across the identified subpopulations of adipocytes in human BAT. o, Feature plot for FASN and UCP1 expression within the adipocyte population from human BAT.
