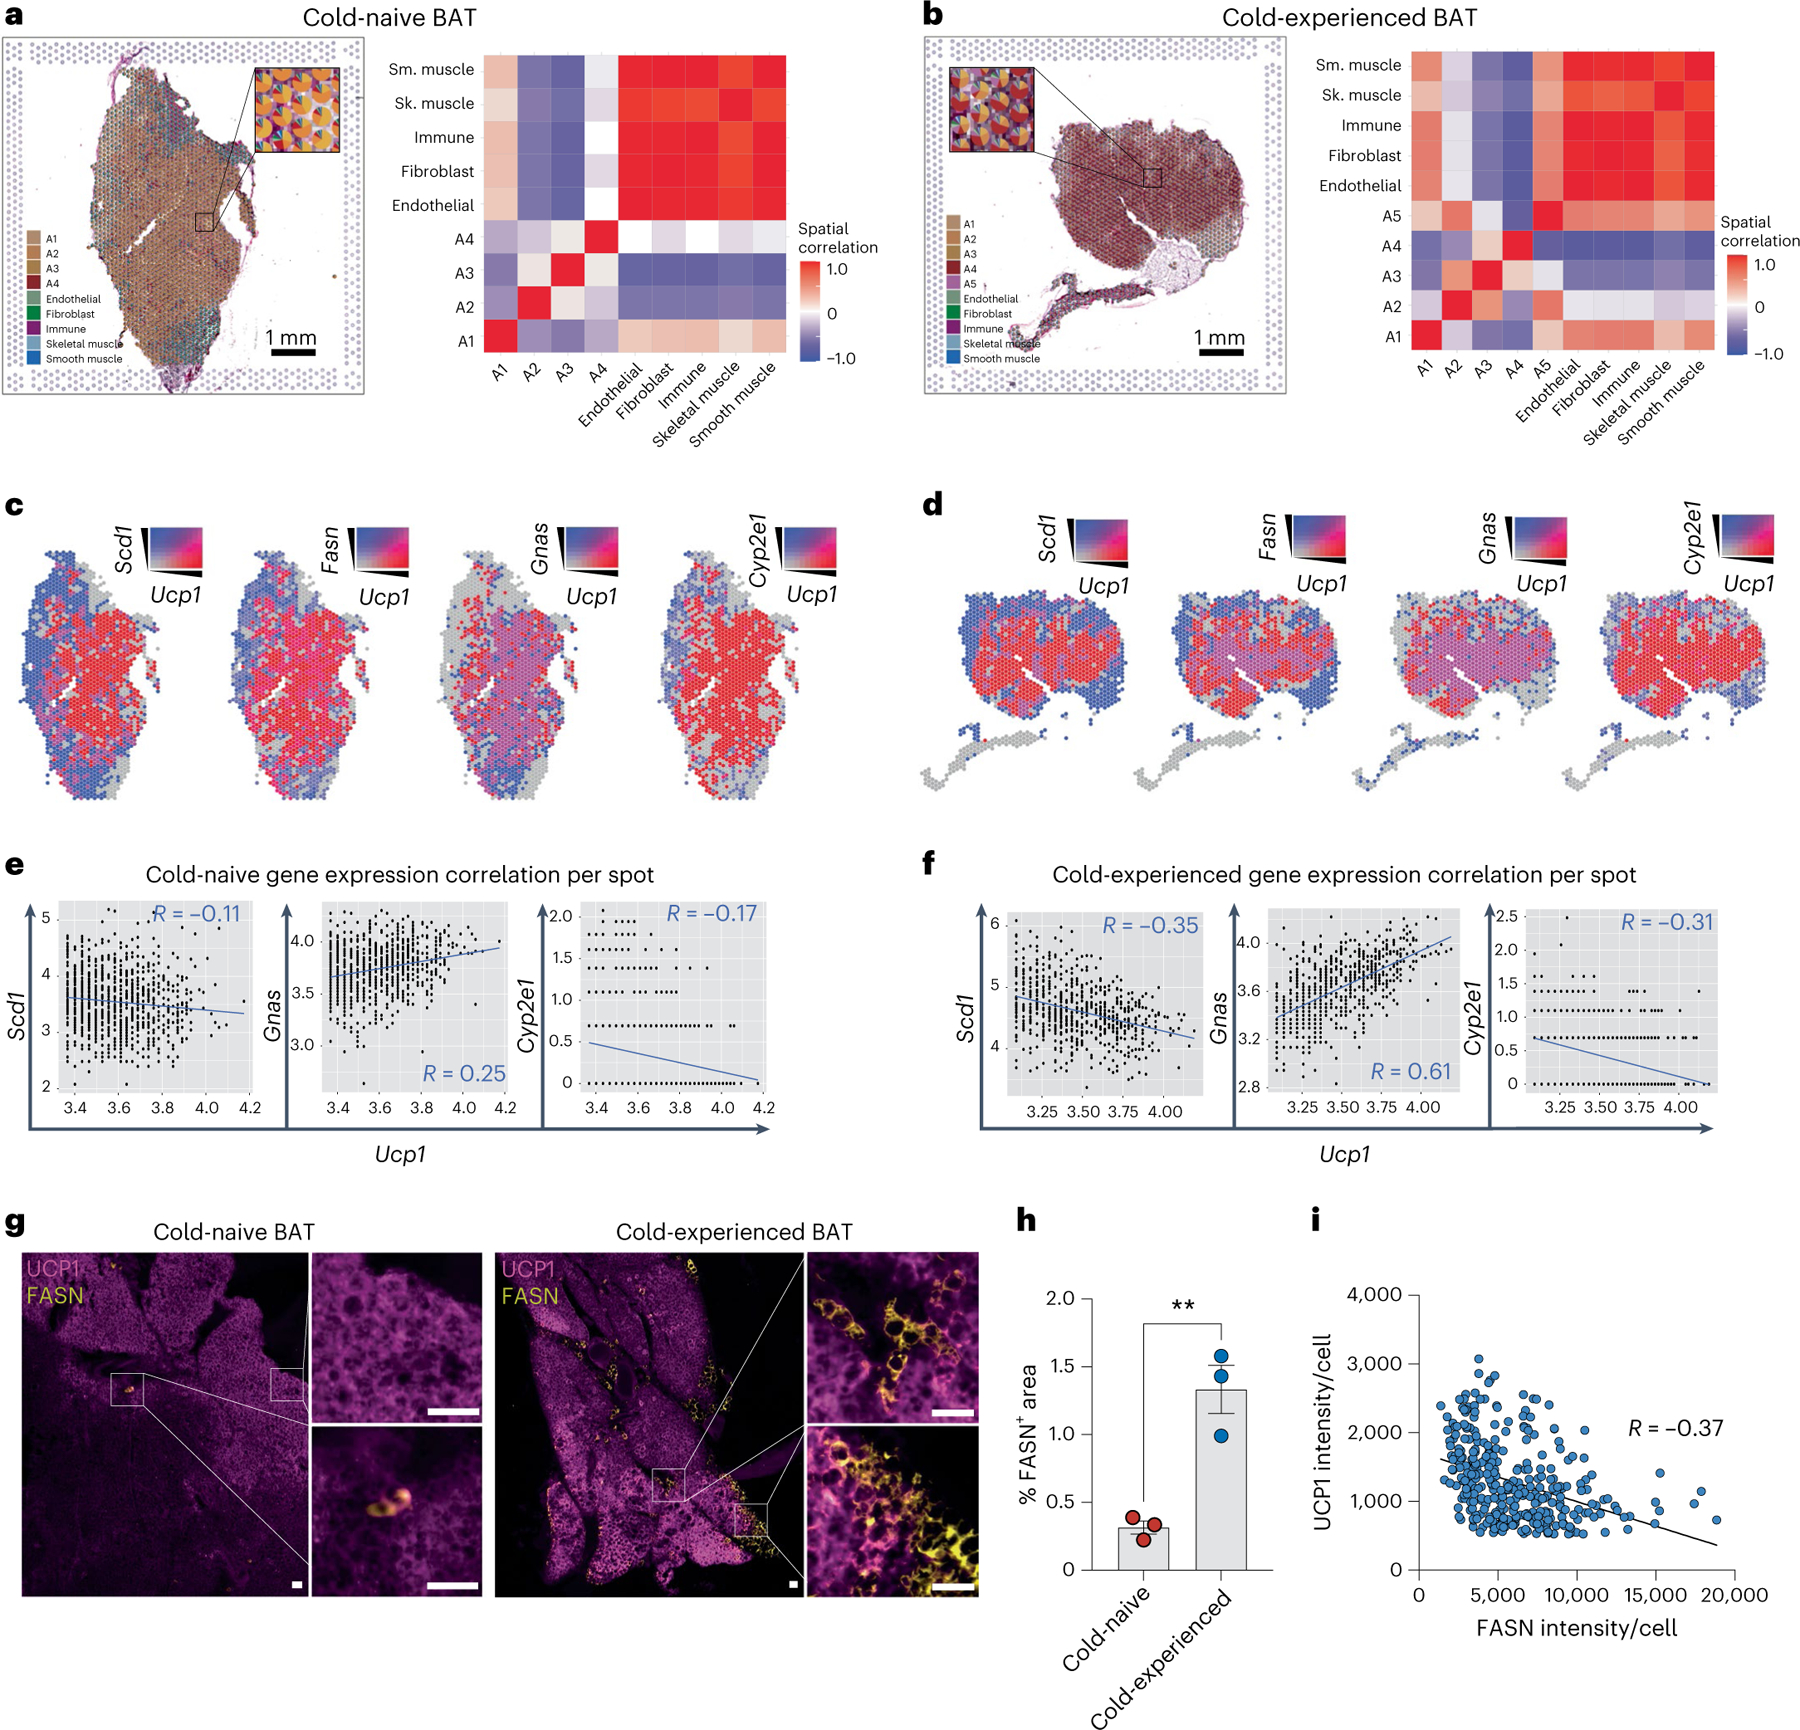
Fig. 5 |. Lipogenic brown adipocytes show distinct spatial tissue patterns in brown adipose tissue following a primary thermogenic response.

a–g, Spatial transcriptomics of BAT from cold-naïve and cold-experienced mice housed at thermoneutrality. a,b, Scatter pie plot with each spot in the cold-naïve (a) and cold-experienced (b) BAT section coloured according to the cell-type proportions estimated by SpaDecon (left); the cell-type-level spatial correlation heat map was constructed using the SpaDecon estimated cell-type proportions across all spots in the cold-naïve BAT section (right). c, Spatial feature plot of Ucp1 with Scd1, Fasn, Gnas and Cyp2e1 in the cold-naïve BAT section. d, Spatial feature plot of Ucp1 with Scd1, Fasn, Gnas and Cyp2e1 in the cold-experienced BAT section. e, Quantification of gene expression correlation between Scd1, Gnas and Cyp2e1 per spot with Ucp1 expression above the 50th percentile for the cold-naïve BAT section. f, Quantification of gene expression correlation between Scd1, Gnas and Cyp2e1 per spot with Ucp1 expression above the 50th percentile for the cold-experienced BAT section. g–i, Immunofluorescence of Ucp1 and Fasn in BAT sections of cold-naïve and cold-experienced mice. g, Representative images from each condition. Scale bar, 50 μm. h, Quantification of Fasn+ area across the two conditions (n = 3 biological replicates per condition, with 2–3 technical replicates per biological replicate). i, Quantification of UCP1 and FASN intensity in single brown adipocytes from immunofluorescence analysis of cold-experienced BAT. Error bars indicate means ± s.e.m. **P < 0.01. R values were calculated by Pearson’s correlation.
