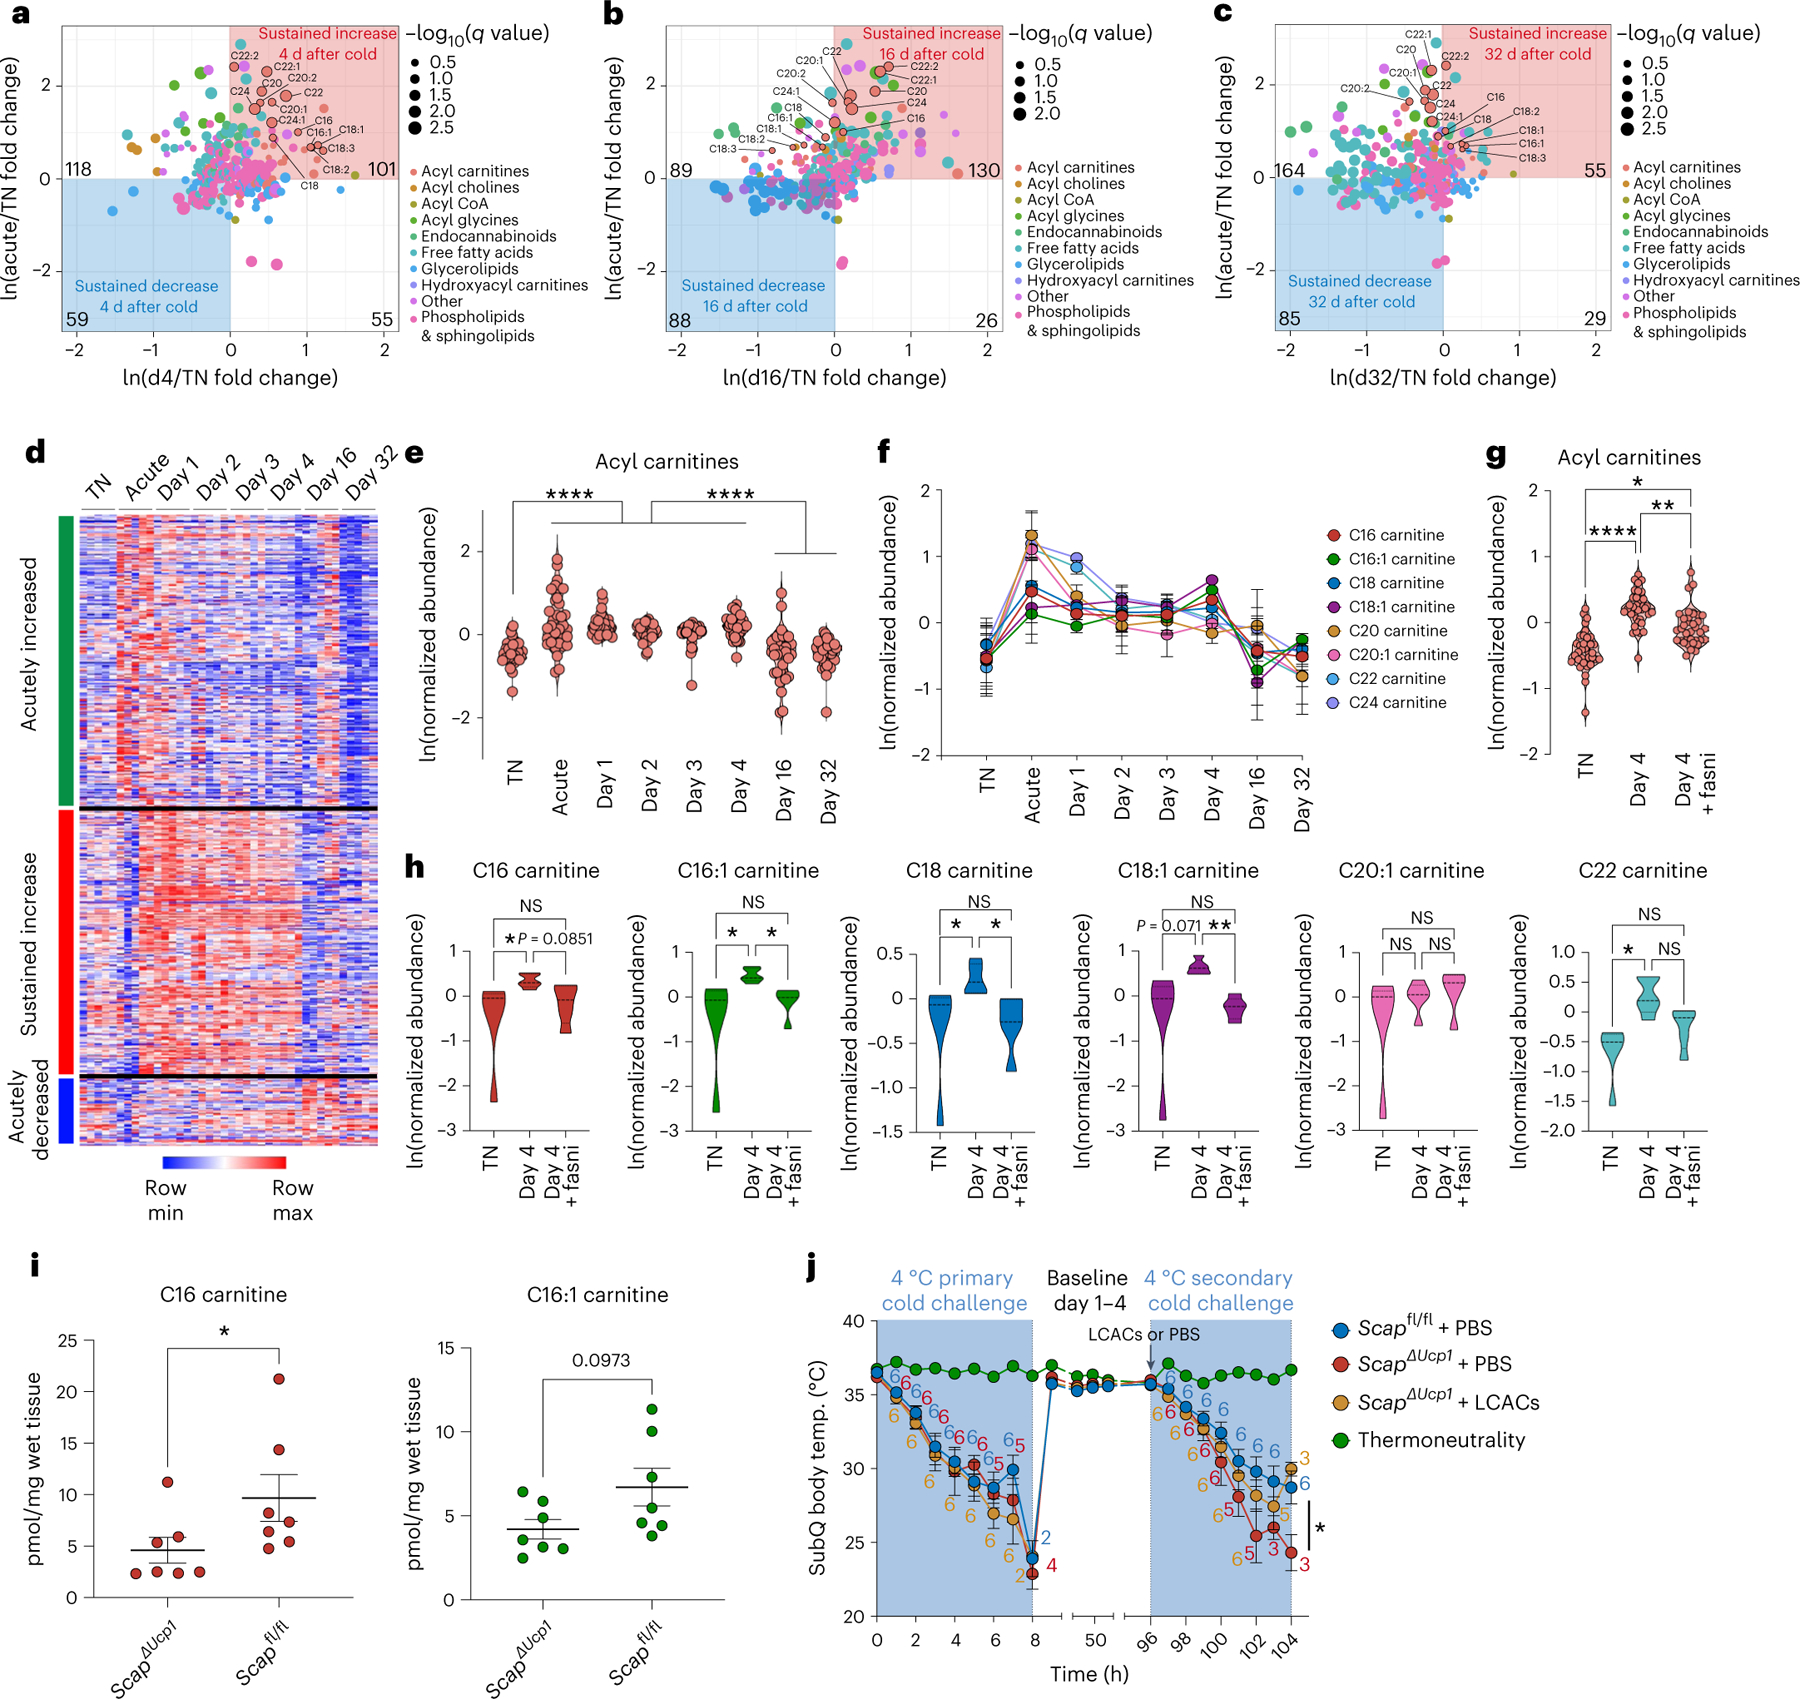
Fig. 6 |. A primary thermogenic response results in lipogenesis-driven sustained elevation of acylcarnitines in brown adipose tissue.

a–h, Analysis of differentially abundant metabolites in BAT by untargeted metabolomics in mice exposed to acute cold followed by thermoneutral conditions for different times, including a thermoneutral (TN) baseline comparison (n = 5 independent animals for each condition in a–h). a, Comparison of relative abundances of lipid metabolites in acutely cold-exposed BAT (acute), day 4 after transient cold BAT (d4) and TN BAT. b, Comparison of relative abundances of lipid metabolites in acute BAT, day 16 after transient cold BAT (d16) and TN BAT. c, Comparison of relative abundances of lipid metabolites in acute BAT, day 32 after transient cold BAT (d32) and TN BAT. For a–c, the dot size reflects the −log10(q value) of the most significant comparison of d4/TN and acute/TN for the given metabolite. Colours of dot reflects type of lipid metabolite. Long-chain acylcarnitines (LCACs) are highlighted. d, Heat map depicting temporal patterns of relative metabolite abundances in BAT following cold challenge. e, Relative abundance of acylcarnitine species in BAT in different experimental conditions. Each data point represents the average value across replicates for each acylcarnitine species. f, Plot of average abundance of indicated LCACs in BAT from different experimental conditions. g, Comparison of total acylcarnitine species in BAT between TN, day 4 and day 4 with Fasni. Each data point represents one species. h, Comparison of indicated LCACs in BAT between TN, day 4 and day 4 with Fasni. i, Absolute measurements of C16 carnitine and C16:1 carnitine in BAT in ScapΔUcp1 mice (n = 7) versus Scapfl/fl mice (n = 7) 4 d following primary thermogenic challenge. j, Subcutaneous body temperature during primary and secondary cold exposure of ScapΔUcp1 mice treated with PBS or LCACs at the start of secondary cold exposure, including Scapfl/fl mice treated with PBS (n = 6 independent animals for each condition). Error bars indicate means ± s.e.m. *P < 0.05; **P < 0.01; ****P < 0.0001.
