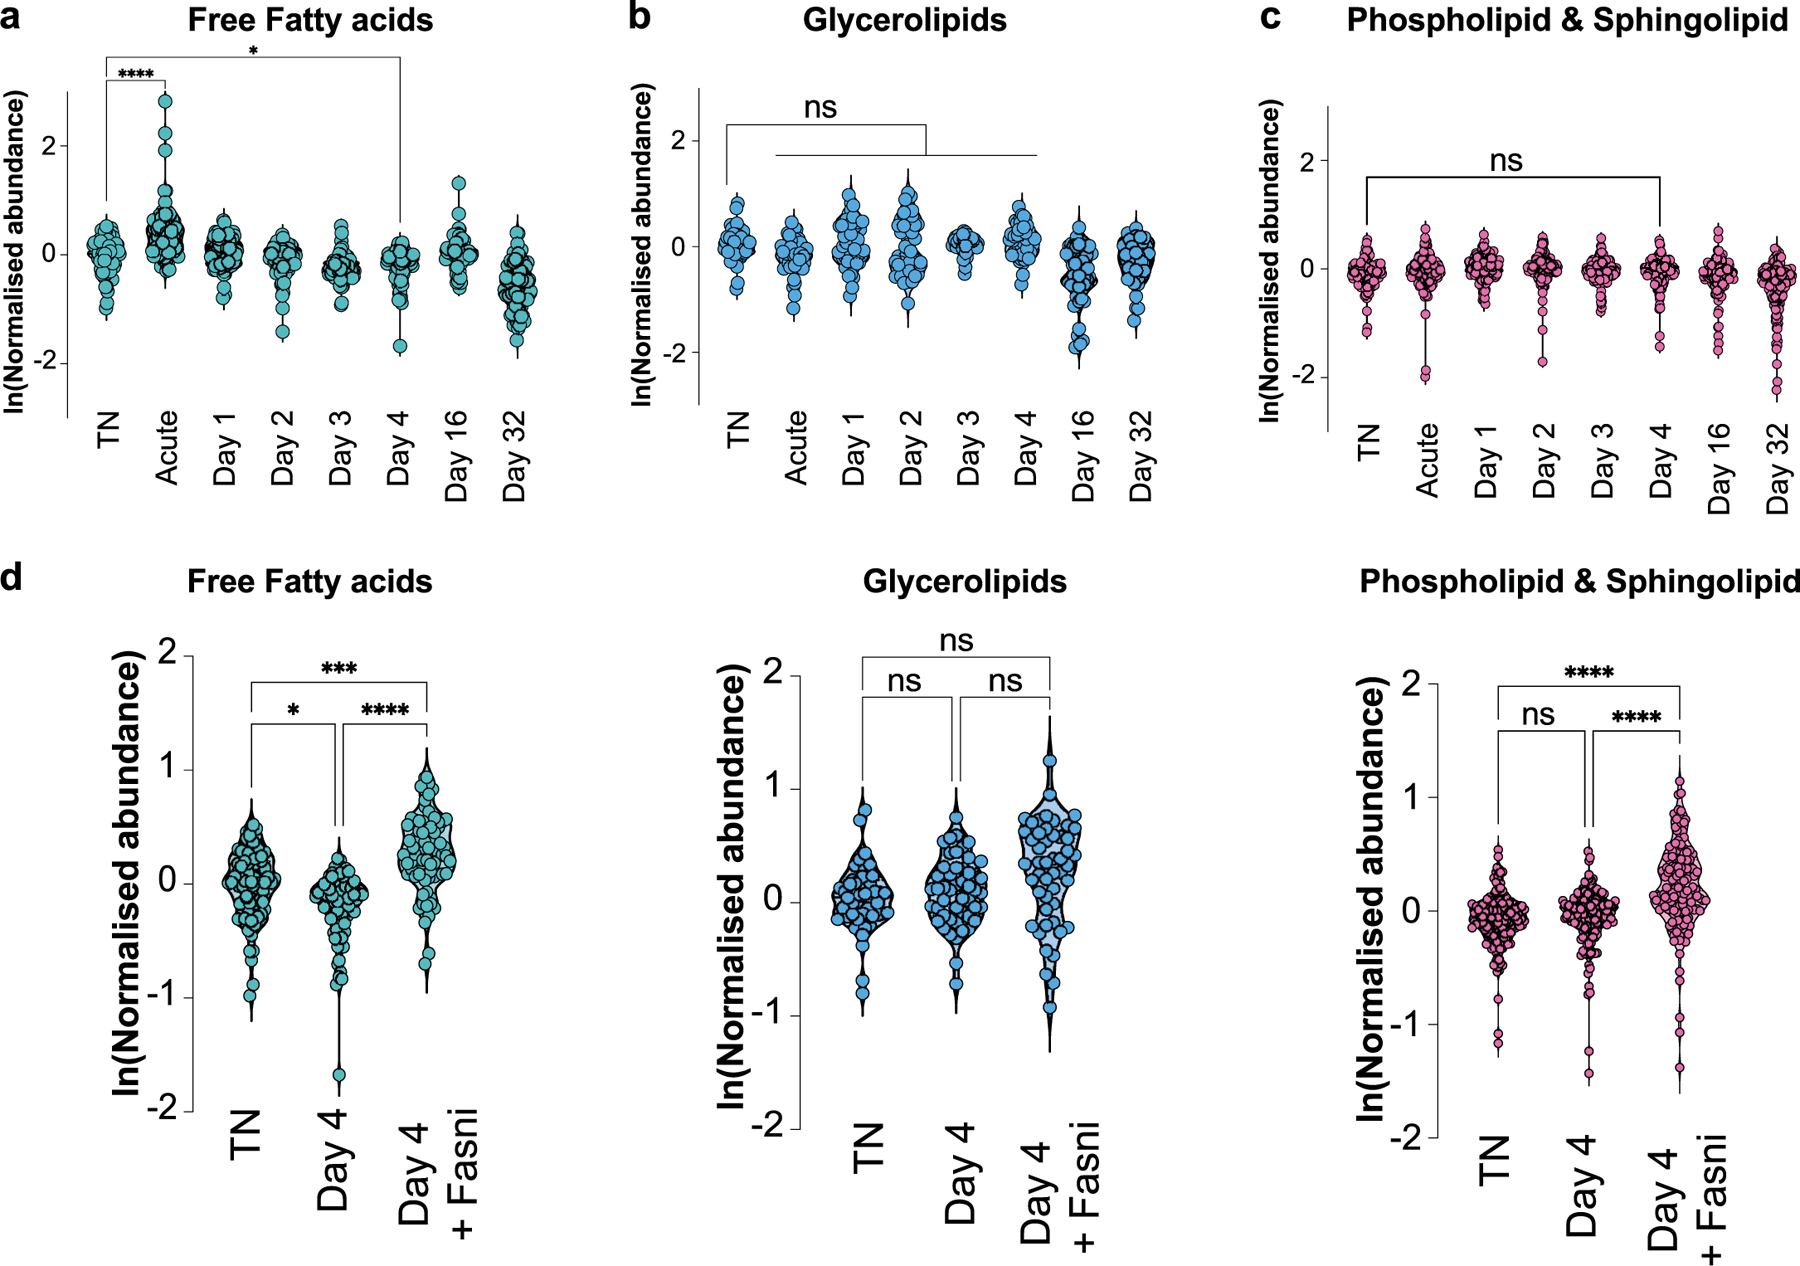
Extended Data Fig. 6 |. Total free fatty acids, glycerolipids, or phospholipids & sphingolipids in brown adipose tissue following a primary thermogenic response.

a-d, Relative abundance and distribution of free fatty acids (a), glycerolipids (b), and phospholipid & sphingolipid (c) species in BAT in different experimental conditions. Data presented in panels a-d is based on metabolomics from n = 5 independent animals per condition. Each data point represents the average value across replicates for each species. d, Comparison of indicated lipid metabolite species in BAT between TN, day 4, and day 4 with Fasn inhibition (Fasni). Each data point represents the average value across replicates for each species. Error bars indicate means ± s.e.m. ns, not significant; *, P < 0.05; ***, P < 0.001; ****, P < 0.0001. Exact P values are presented in the source data file for Extended Data Fig. 6.
