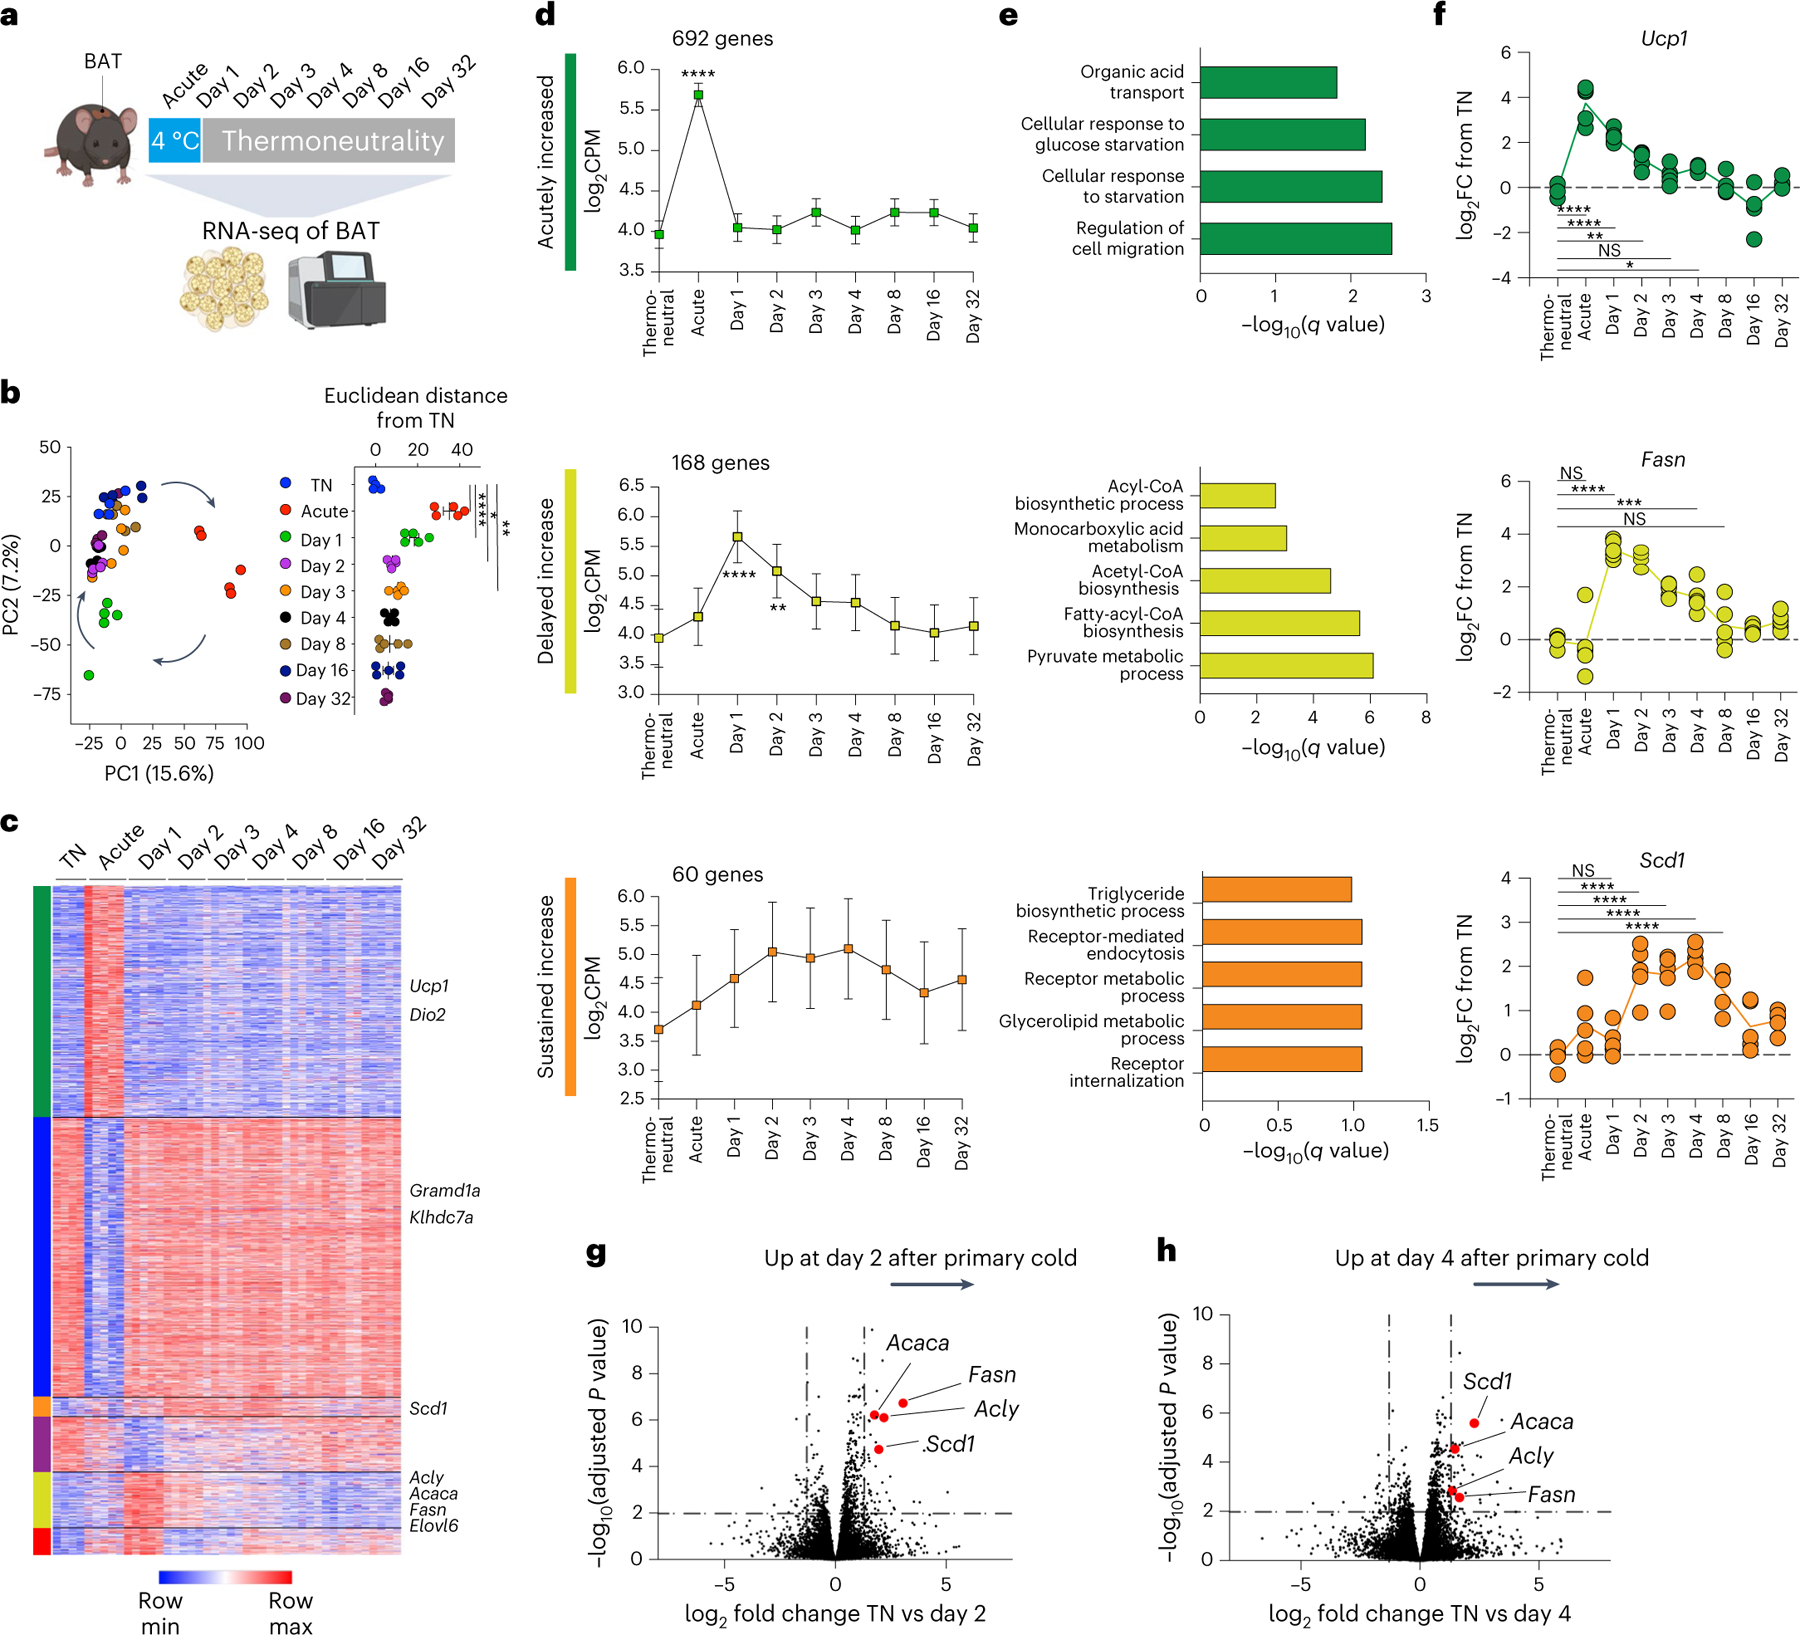
Fig. 2 |. A primary thermogenic response leads to delayed induction of a lipid biosynthesis programme in brown adipose tissue independent of sustained cold exposure.

a, Experimental schematic for the transcriptional profiling of BAT in mice exposed to acute cold followed by thermoneutral conditions for different time durations including a thermoneutral baseline comparison (n = 5 independent animals for each condition, except for thermoneutral baseline n = 4). b, Principal component analysis of RNA-seq results (left) and Euclidean distances between the average of thermoneutrality samples and every other sample in unfiltered feature space (right). c,d, Heat map (c) and line graphs (d) show the log-transformed counts per million across different time points. K-means clustering was used to classify the temporal patterns of differentially expressed genes to six clusters, of which (1) acutely increased (green), (2) delayed increase (yellow) and (3) sustained increase (orange) clusters are shown. e, Gene Ontology analysis (Enrichr) for gene sets in each cluster. f, Representative differentially expressed genes from each cluster. g,h, Analysis of differentially expressed genes from specific time points relative to thermoneutrality are shown in volcano plots, with highlighted genes involved in DNL. Error bars indicate means ± s.e.m. NS, not significant; *P < 0.05; **P < 0.01; ***P < 0.001; ****P < 0.0001.
