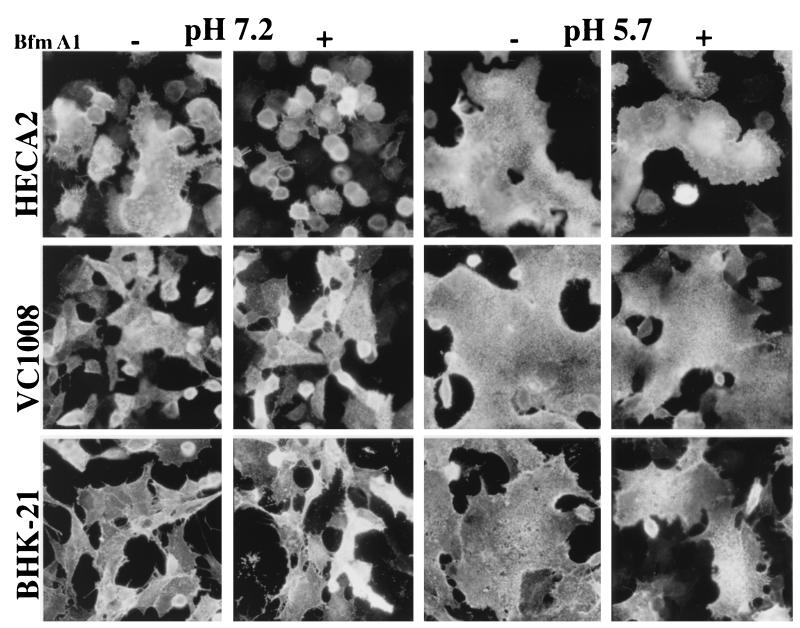
FIG. 8.
Cell surface distribution and fusion activity of the viral G protein following Bfm A1 treatment. HECA2, BHK-21, and Vero C1008 cells at subconfluent cell density were infected with VSVIND at an MOI of 2. Beginning at 3 hpi, the cells were cultured either in the presence (+) or in the absence (−) of 5 nM Bfm A1. At 9 hpi, the cells were briefly exposed to either low pH (pH 5.7) or neutral pH (pH 7.2) as indicated for 1 min at room temperature, subsequently neutralized with incubation medium, and incubated for a further 15 to 20 min at 37°C. Cells were fixed in 3% paraformaldehyde, and viral G protein was detected at the cell surface by using a mouse monoclonal antibody to the viral G protein followed by incubation with an Alexa 488-conjugated goat anti-mouse immunoglobulin secondary antibody. Fluorescence was monitored and photographed with a Nikon Axiophot microscope equipped with epifluorescence and a 35-mm camera.

