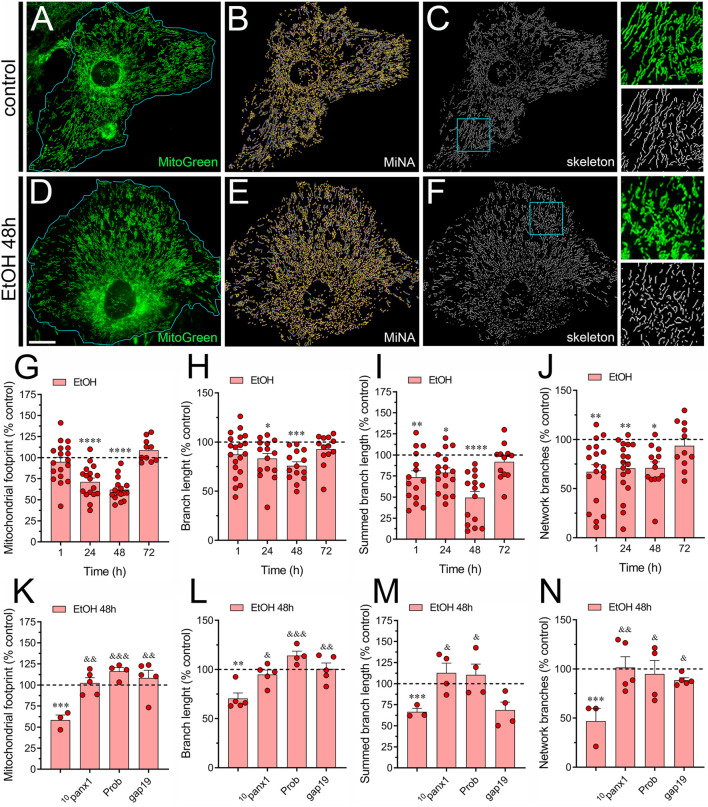
FIGURE 4.
Panx1 and Cx43 hemichannels contribute to the ethanol-induced alterations in mitochondrial network morphology in astrocytes. (A–F) Representative photomicrographs of MitoGreen (green) fluorescence, segmented MitoGreen fluorescence with MiNa software and skeletonized MitoGreen fluorescence by astrocytes under control conditions (A–C) or following the treatment with 100 mM ethanol for 48 h (D–F). Insets: × 2.5 magnification of the indicated area of panels (C, F). (G–J) Averaged data normalized to control conditions (dashed line) of mitochondrial footprint (G), branch length (H), summed branch length (I) and number of network branches (J) by astrocytes treated with 100 mM ethanol for several time periods. (K–N) Averaged data normalized to control conditions (dashed line) of mitochondrial footprint (G), branch length (H), summed branch length (I) and number of network branches (J) by astrocytes treated for 48 h with 100 mM ethanol alone or plus the following pharmacological agents: 100 µM 10panx1, 500 µM probenecid (Prob) or 100 µM gap19. *p < 0.05, **p < 0.01, ***p < 0.001, ****p < 0.0001; ethanol compared to control conditions; & p < 0.05, && p < 0.01; &&& p < 0.001; effect of pharmacological agents compared to ethanol treatment (one-way ANOVA followed by Tukey’s post hoc test). Each dot represents an independent culture experiment from a different litter of animals. The value reflects the mean of at least three coverslip replicates, with a minimum of 60 cells analyzed per coverslip. Calibration bar: 30 μm.

