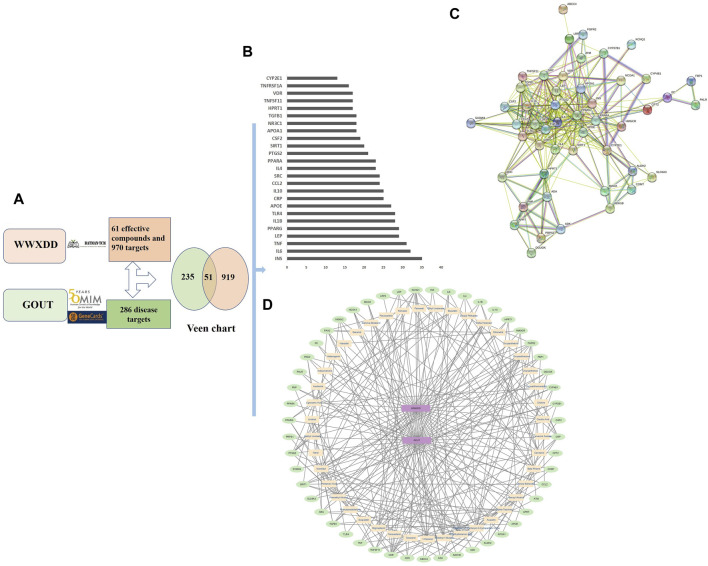
FIGURE 3.
Network pharmacology showed Venn diagram, intersection gene, protein interaction and WWXDD-target-gout visual regulatory network. (A) A total of 61 effective compounds and 970 gene action targets of WWXDD were obtained through the BATMAN-TCM platform, while 286 related genes of gout were selected from GeneCards and OMIM databases. By intersecting these two sets of targets, a final set of 51 targets for the intersection between WWXDD and gout disease was identified. (B) The core target gene diagram revealed 26 core target genes with higher-than-average degree values. Notably, inflammatory factors IL-6, TNF-α, IL-1β, TLR4, and IL-10 exhibited degree values greater than twice the average value. Additionally, metabolism-related genes such as INS, LEP, APOE also displayed higher degrees. (C) The protein interaction network diagram depicted a network consisting of 51 protein nodes connected by 313 interaction relationships (i.e., edges), with three protein nodes lacking any interaction relationship. The average local clustering coefficient was calculated to be 0.683 while the average degree was found to be 12.3. (D) The visual regulatory network illustrated the connections between target genes (represented by elliptical nodes on the left side) and effective compounds (represented by elliptical nodes on the right side). This intricate connection reflects multiple pathways through which various effective compounds in WWXDD act upon target genes.

