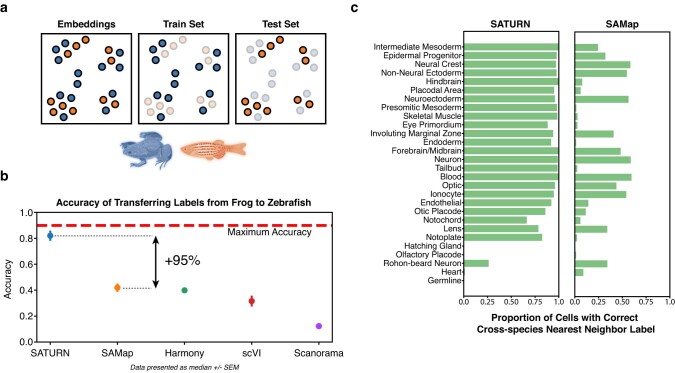
Extended Data Fig. 5. Label transfer from from frog to zebrafish embryogenesis datasets.
(a) Explanation of how multi-species embeddings are scored. A joint embedding space, containing cells from multiple species, is split by species into a training set and a test set. A classification model to predict cell types is trained on the frog training set cells, and evaluated on the zebrafish test set cells. The maximum test set accuracy achievable will be lower than 100% if the test set species contains specific cell types that can not be predicted by a classifier trained on the training species. Blue color denotes frog, while orange denotes zebrafish. (B) Median performance of SATURN compared to alternative methods. The performance is evaluated using the prediction accuracy of a logistic classifier model trained to differentiate frog cell types and tested on predicting the cell type annotations of zebrafish cells. Higher values indicate better performance, and 90% is the maximum accuracy that can be reached by label transfer on this dataset. SAMap represents a version of the SAMap method in which cell-type annotations are used to integrate datasets. Vertical position of scatter plot points represents the median accuracy score across 30 runs for each method. Error bars represent standard error. For batch correction methods (Harmony, scVI and Scanorama), the input genes are selected as the one to one homologs determined by ENSEMBL. (c) SATURN produces more homogeneous clusters than SAMap, and these clusters contain accurate multi species cell types. Bars represent the percentage of cells from frog that are nearest neighbors of zebrafish cells of the given cell type conserved across these two species. Cell types are ordered by frequency.

