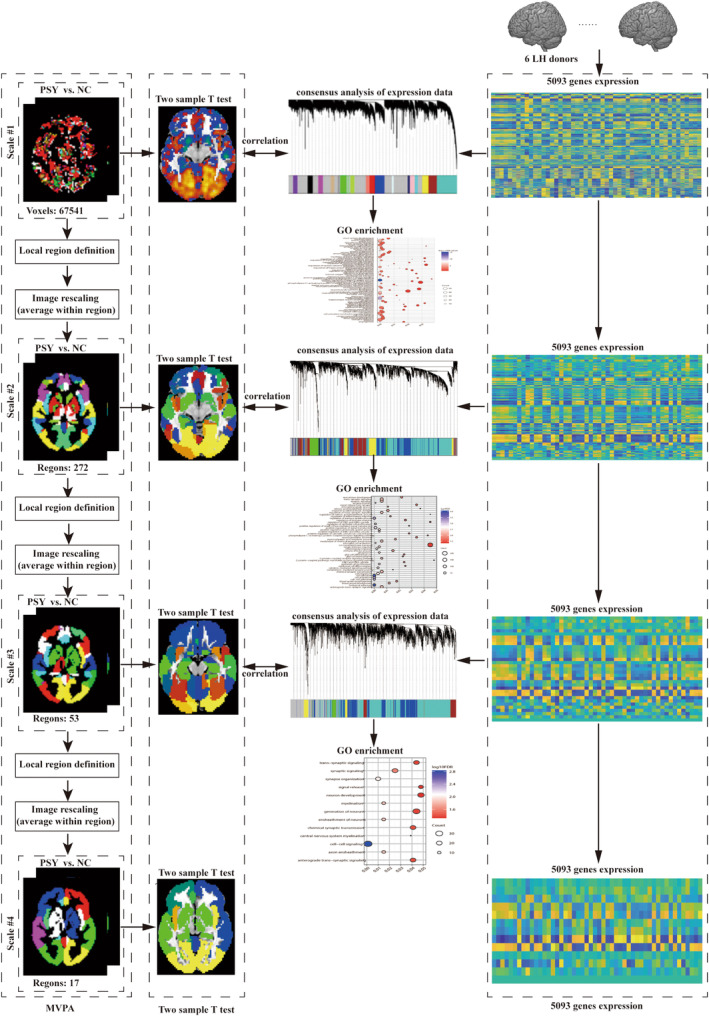
FIGURE 1.

The flowchart of the spatial‐scale analysis to acquire the information of classifying schizophrenia from HCs and to characterize the involved gene expression profiles correlated with ReHo difference in schizophrenia at each spatial scale.

The flowchart of the spatial‐scale analysis to acquire the information of classifying schizophrenia from HCs and to characterize the involved gene expression profiles correlated with ReHo difference in schizophrenia at each spatial scale.