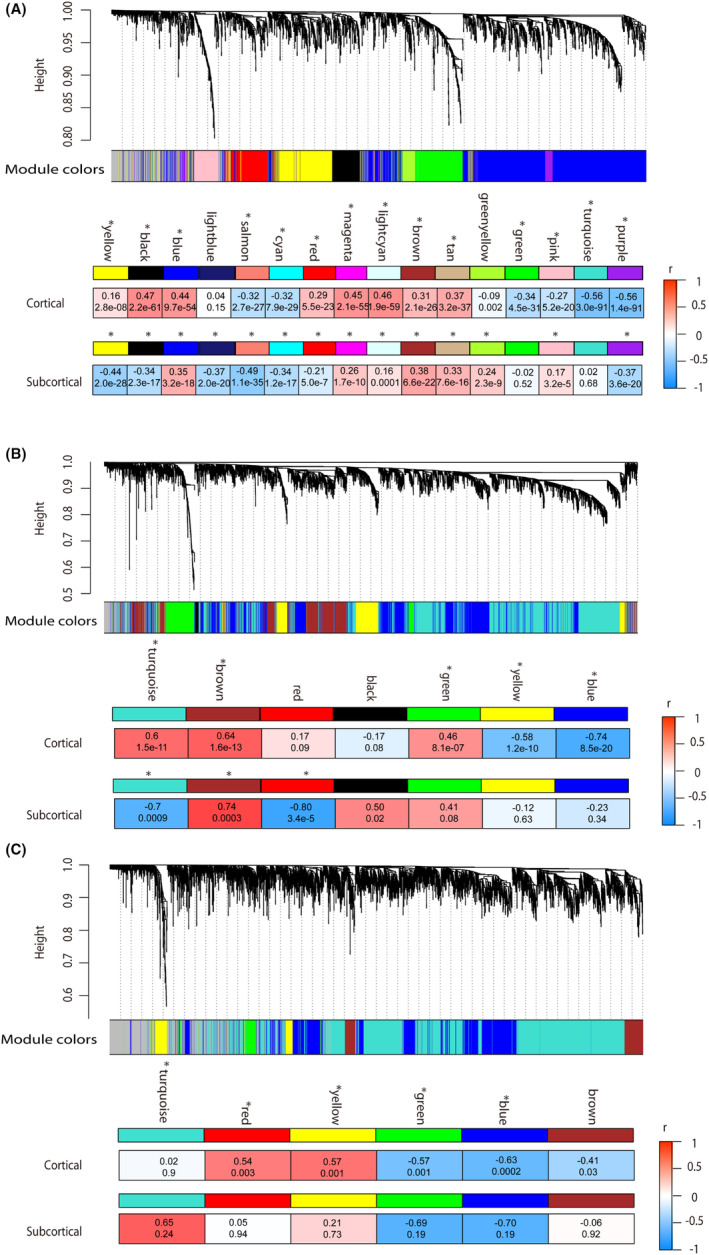
FIGURE 2.

Pearson's correlation between MEs of gene modules and t‐statistics values of case–control ReHo differences in cortical and subcortical regions of schizophrenia at Scales 1–3. (A–C) Showed the correlation coefficients between MEs of gene modules and ReHo differences in Scale 1 (voxel level), Scale 2 (272 cerebral regions), and Scale 3 (53 regions), respectively. The color bar represents the correlation coefficients. At Scale 4 (17 regions), the limited number of cerebral regions prevented the implementation of WGCNA analysis, leading to underpowered analysis and inaccurate network modules.
