
FIGURE 4.
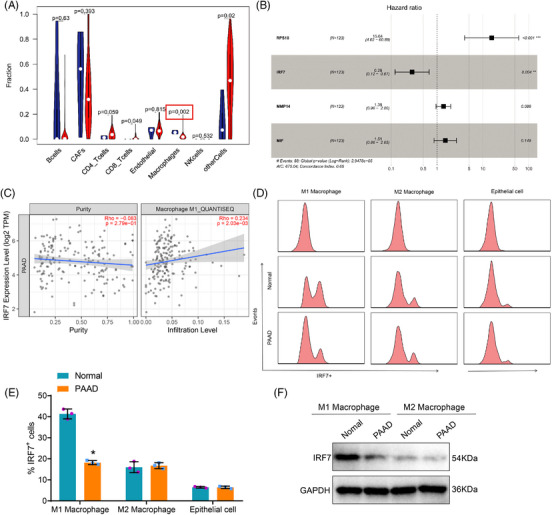
Construction of a lipid metabolism marker gene‐based prognostic risk scoring model using the Gene Expression Omnibus (GEO) database. (A) Relationship between pancreatic adenocarcinoma (PAAD) and tumour‐infiltrating immune cells based on TCGA PAAD transcriptome data (N = 183), with blue representing the control group and red representing the experimental group. (B) The forest plot of the Cox risk scoring model shows the model genes and their risk coefficients. (C) Immune infiltration analysis using TIMER v2.0 database. (D) Separation of M1 and M2 macrophages in different tissues by flow cytometry. (E) Quantitative statistics of flow cytometry. (F) Western blot analysis of IRF7 expression in M1 and M2 macrophages isolated from different tissues. Asterisk (*) indicates p < .05 compared to the normal group, with all cell experiments repeated three times.