
FIGURE 6.
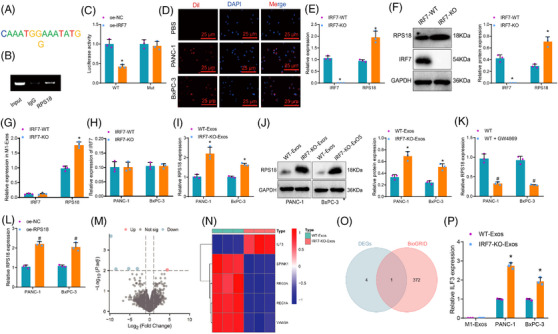
Selection of downstream target genes regulated by IRF7/RPS18 transferred by M1‐Exos to pancreatic adenocarcinoma (PAAD) cells. (A) Using LASAGNA‐Search 2.0 to predict the binding sites of the transcription factor IRF7 with the target gene RPS18. (B) Observing the content of amplification products in ChIP‐qPCR in M1 macrophages by agarose gel electrophoresis. (C) Analysing the activity of the RPS18 promoter‐driven luciferase in HEK293T cells using the luciferase reporter gene method (N = 3). Asterisk (*) indicates p < .05 compared to the pGL3‐basic + IRF7 group, and the cell experiments were repeated three times. (D) Observing the uptake of M1‐Exos by PANC‐1/BxPC‐3 cells using laser scanning confocal microscopy, with red fluorescence representing Dil and blue fluorescence representing DAPI nuclear staining (scale bar: 50 µm). (E and F) Detecting the gene expression of IRF7 and RPS18 in various groups of M1 macrophages using Western blot and RT‐qPCR. (G) Detecting the gene expression of IRF7 and RPS18 in various groups of M1‐Exos using RT‐qPCR. (H) Detecting the gene expression of IRF7 in various groups of PAAD cells using RT‐qPCR. (I and J) Detecting the gene expression of RPS18 in various groups of PANC‐1/BxPC‐3 cells using RT‐qPCR and Western blot. (K and L) RT‐qPCR was used to detect the expression level of RPS18 in PAAD cells co‐cultured in different groups. (M) Volcano plot showing differentially expressed mRNA between PANC‐1 cells co‐incubated with three WT‐Exos and three IRF7‐KO‐Exos in high‐throughput sequencing data. (N) Heatmap revealing the differential expression of five genes in sequencing data, with WT‐Exos (N = 3) and IRF7‐KO‐Exos (N = 3) representing samples of M1 macrophages secreted Exos co‐cultured before and after IRF7‐knockout with PAAD cells. (O) Venn diagram showing the intersection between differentially expressed genes in sequencing data and genes predicted by BioGRID to interact with RPS18. (P) Detecting the gene expression of ILF3 in various groups of M1‐Exos and PANC‐1/BxPC‐3 cells using RT‐qPCR. Asterisk (*) indicates p < .05 compared to the IRF7‐WT or WT‐Exos group, asterisk (*) indicates p < .05 compared to the IRF7‐WT group and symbol (#) indicates p < .05 compared to the WT group or oe‐NC group, with cell experiments repeated three times.