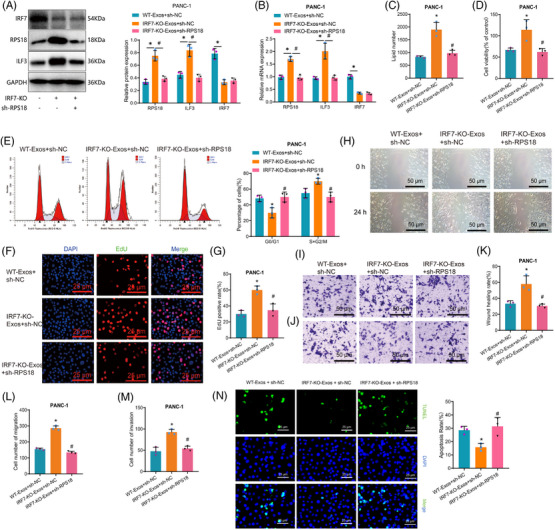
FIGURE 7.

Impact of IRF7/RPS18 regulation of ILF3 expression in M1‐Exos on the biological functions of pancreatic adenocarcinoma (PAAD) cells. (A) Evaluation of protein expression levels of RPS18, IRF7 and ILF3 in PANC‐1 cells using Western blot analysis in different groups. (B) Assessment of mRNA expression levels of RPS18, IRF7 and ILF3 in PANC‐1 cells across various groups via RT‐qPCR. (C) Metabolomic analysis of total lipid content in PANC‐1 cells in each group. (D) MTT assay to measure cell viability in each group of PANC‐1 cells. (E) Flow cytometry analysis of cell cycle changes in PANC‐1 cells in each group. (F) EdU assay to assess the proliferative capability of PANC‐1 cells (scale bar: 20 µm). (G) Statistical analysis of the EdU assay results. (H) Scratch assay to assess the migration ability of PANC‐1 cells (scale bar: 50 µm). (I and J) Transwell assay to measure the migration and invasion ability of PANC‐1 cells (scale bar: 50 µm). (K) Statistical analysis of the scratch assay results. (L and M) Statistical analysis of the Transwell assay results. (N) TUNEL assay to determine the apoptosis rate of PANC‐1 cells (scale bar = 25 µm). Asterisk (*) indicates p < .05 compared to the WT‐Exos + sh‐NC group and symbol (#) indicates p < .05 compared to the IRF7‐KO‐Exos + sh‐NC group. Cell experiments were repeated three times.
