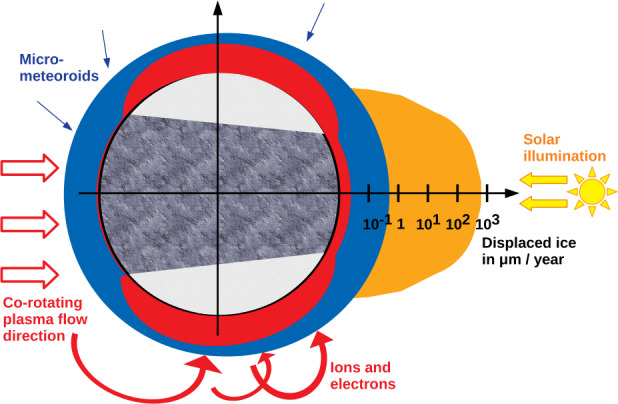
Fig. 13.

Sketch of water ice removal or turnover rates on Ganymede’s surface in units of μm yr−1. Orange shape: effect of thermal sublimation, blue: micrometeoroid impacts, red: irradiation-related rates (dominated by ion sputtering). Note the logarithmic scale of the rates (going from 0.1 to 1000 μm yr−1). The sketch is centred on the equatorial plane of the anti-Jovian side. Ganymede’s leading hemisphere with respect to Jupiter, the Jovian plasma is on the dayside to the right. The grey band and the white pole caps symbolise the surface areas of low and high albedo. Figure reproduced from Galli et al. (2024)
