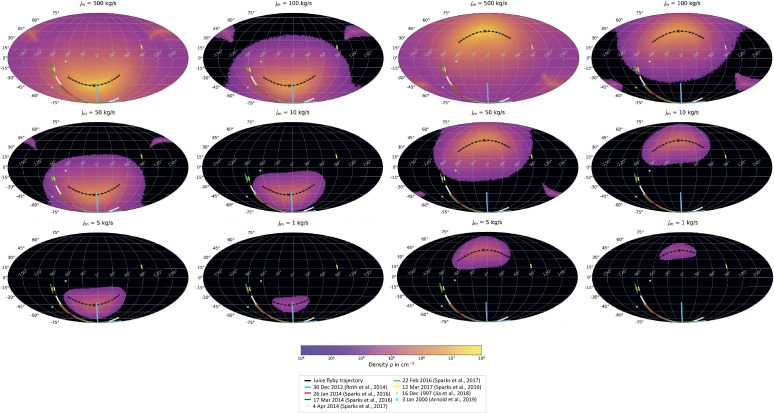
Fig. 17.
Colour maps expressing the H2O density predicted along the JUICE trajectory as a function of plume location on the surface. Left two columns first flyby, second two columns second flyby. Blacked out areas correspond to regions where the plume density along the trajectory does not exceed the atmospheric H2O density using an atmospheric profile from Shematovich et al. 2005. Black line indicates the spacecraft trajectory. Presumptive plume sources indicated by coloured lines and dots. [Reproduced from Winterhalder and Huybrighs (2022)]

