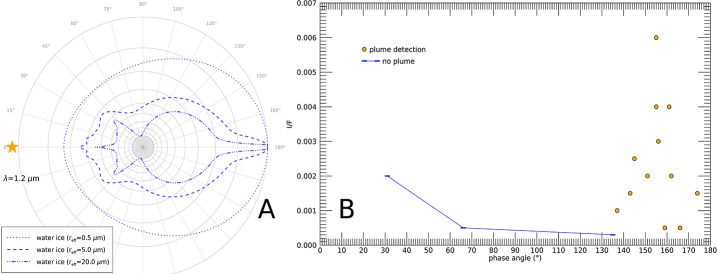
Fig. 20.
Panel A: Variation of water ice scattering phase function with respect to grain size, evaluated at 1.2 μm wavelength through the Mie theory for lognormal distributions with effective radius of 0.5 μm (dotted line), 5 μm (dashed line), and 20 μm (dot-dashed line). The angular values on the grid represent the phase angle, hence the light source is at the left (star symbol). All curves are normalised to their maximum value, which is at 180° phase angle. Panel B: Enceladus plume reflectance level (∼1.0–2.4 μm) resulting from a preliminary overview of a sample of Cassini/VIMS data as a function of solar phase angle (orange circles). Cases of non-detection are reported as upper limits in blue

