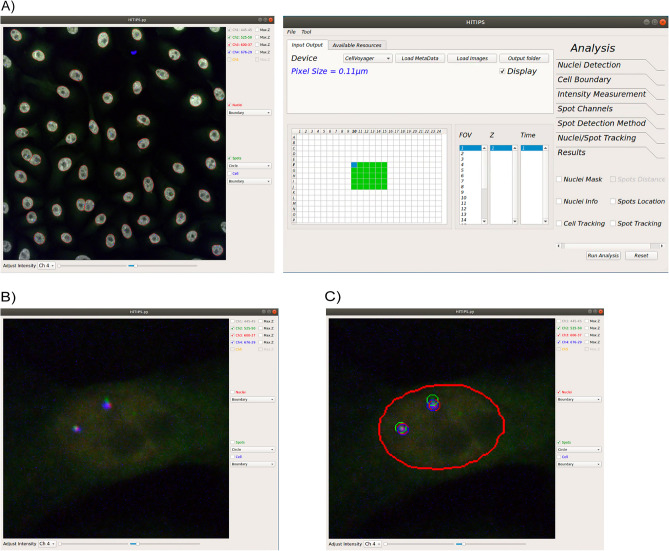
Figure 1.
Examples of the HiTIPS GUI. (A) Representative screenshot of the HiTIPS GUI for HTI dataset selection and on-demand image loading, with metadata loading and integration in various formats, including CellVoyager and Micro-Manager. (B) Representative screenshot of the image visualization controls in the HiTIPS GUI, including, fluorescence channel toggling and z-projected views for 3D z-stacks, and fluorescence intensity visualization adjustment. (C) Representative screenshot of the overlayed display in the HiTIPS GUI of nuclei masks borders (red) and spot detection in 2 different channels (red and green circles) output from image HiTIPS analysis modules.

