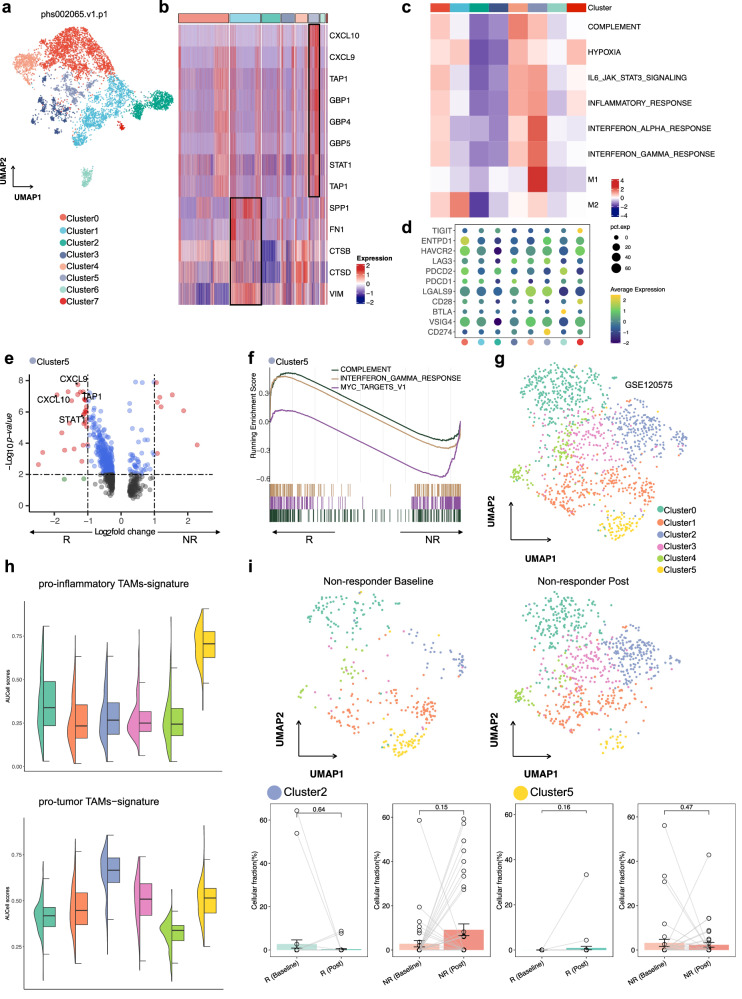
Fig. 3. Analysis of monocyte/TAMs clusters and pathway activities, and immunotherapy response in the phs002065 and GSE120575 datasets.
a UMAP visualization of all re-clustered monocytes/macrophages in the phs002065 dataset. b Heatmaps for monocytes/macrophages clusters in the phs002065 dataset for select pro-inflam and pro-tumor TAMs markers highlighted. c Heatmap shows the difference in pathway activities scored by GSVA per cell between different monocytes/macrophage clusters in the phs002065 dataset. d The expression of co-inhibitory molecules of monocytes/macrophages clusters in the phs002065 dataset. e Volcano plot showing upregulation of markers specific for pro-inflam TAMs in the Cluster5 (ICB responders) in comparison with the Cluster5 (ICB non-responders). R: responders including ICB PR patients; NR: non-responders including ICB SD/PD patients. f GSEA shows enriched pathways in the Cluster5 (ICB responders). R responders including ICB PR patients, NR non-responders including ICB SD/PD patients. g UMAP visualization of all re-clustered monocytes/macrophages in the GSE120575 dataset. h Violin plots depicting AUCell scores for gene signatures derived for pro-inflam and pro-tumor TAMs across all re-clustered monocytes/macrophages in the GSE120575 dataset. i UMAP plots showing the distribution of pro-inflammatory and pro-tumor TAMs in non-responders after immunotherapy (top); fraction of cells belonging to each immunotherapy phase for in Cluster2 and Cluster5; each point represents one sample; R responders including ICB CR/PR patients, NR non-responders including ICB SD/PD patients. Percentage corrected according to the total number of cells per sample; error bars indicate the 95% CI for the calculated relative frequencies; p value using the default Wilcoxon rank sum test (bottom).

