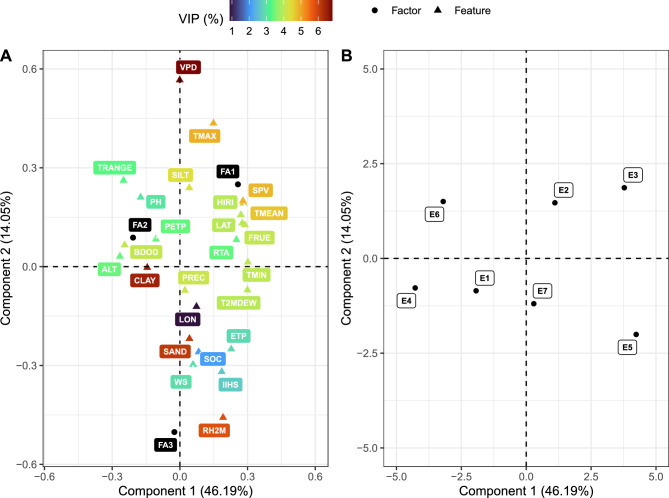
Figure 5.
Results of partial least squares regression: (A) relationship between real (features) and latent (factors) environmental covariates (biplot of the predictors’ and responses’ loadings considering the first two components); and (B) relationship between environments based on both environmental features and factors (biplot of predictors’ scores considering the first two components). FA1, FA2 and FA3 are the first, second and third factors, respectively. For the environmental features’ acronyms, see Table 1. In (A), colour scale represents the variable importance in projection (VIP), in percentage, of each environmental feature.

