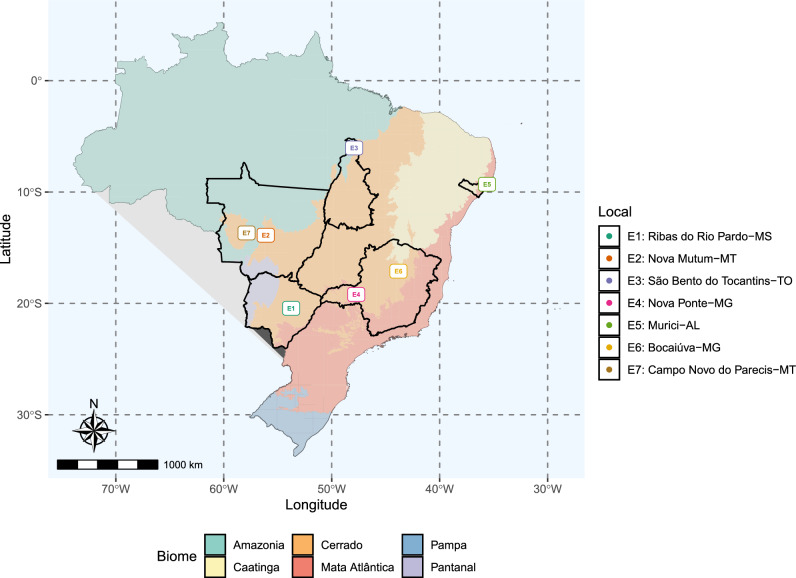
Figure 7.
The map illustrates the locations of trials across Brazil. State borders are depicted by contours, with each colour signifying a distinct Brazilian biome. On the right, the legend provides details on the corresponding municipalities for each trial, while the map labels utilize codes specific to this study. This map was generated using the ggplot2 package, v. 3.5.1 (https://ggplot2.tidyverse.org/articles/ggplot2.html), and the files publicly available at the Brazilian Institute of Geography and Statistics website.

