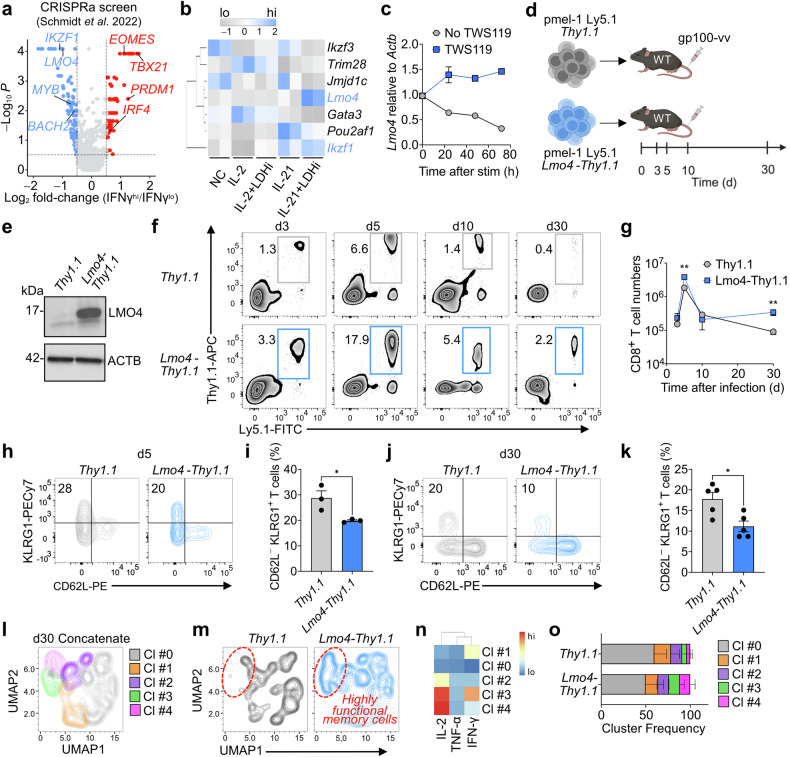
Fig. 1.
Lmo4 overexpression enhances CD8+ T cell stemness and polyfunctionality. a Volcano plot displaying median sgRNA log2-fold change (IFN-γhi/lo sorting bin counts) for each gene tested in the genome-wide CRISPRa screen.17 Genes included in the analysis were exclusively transcription factors or transcription regulators. b Heatmap depicting the expression levels (assessed by RNA-seq) of the top negative hits identified in the CRISPRa screen in CD8+ T cells cultured for 4 d under different conditions: No Cytokine (NC), IL-2, IL-2 + LDHi, IL-21, IL-21 + LDHi23. c q-PCR of Lmo4 mRNA in CD8+ T cells cultured for 72 h with or without TWS119. d Experimental design to assess the impact of Lmo4 overexpression on stem-like CD8+ T cell formation. e Immunoblot of LMO4 in Thy1.1 and Lmo4-Thy1.1 overexpressing T cells. ACTB served as control. f, g Flow cytometry analysis (f) and quantification (g) of splenic pmel-1 CD8+ T cells following transfer of either 105 pmel-1 Ly5.1+ Thy1.1+ or Lmo4-Thy1.1+ CD8+ T cells into wild-type mice infected with gp100-vv. Assessment was conducted at various time points from 3 to 30 days post-transfer, with three mice per group for each time point. Data are from one representative of 3 experiments. h, i Flow cytometry analysis (h) and percentages (i) of CD62L−KLRG1+ splenic pmel-1 T cells 5 d after transfer as in (f, g). j, k Flow cytometry analysis (j) and percentages (k) of CD62L−KLRG1+ splenic pmel-1 T cells 30 d after transfer as in (f, g). l UMAP plot of concatenated Thy1.1+ and Lmo4-Thy1.1+ pmel-1 CD8+ T cells isolated from spleens 5 d after treatment as in (f, g) showing the distribution of clusters (Cl) identified by FlowSOM. m UMAP plot of concatenated Thy1.1+ and Lmo4-Thy1.1+ pmel-1 CD8+ T cells showing differences in cluster distributions. n Heatmap showing the relative expression levels of indicated cytokines in the FlowSOM clusters. o Bar plot of Thy1.1+ and Lmo4-Thy1.1+ pmel-1 CD8+ T cells isolated from spleens 5 d after treatment as in (f, g) quantifying the distribution of clusters assessed by FlowSOM. *P < 0.05, **P < 0.01 (unpaired two-tailed Student’s t-test). (d) was created with BioRender.com

