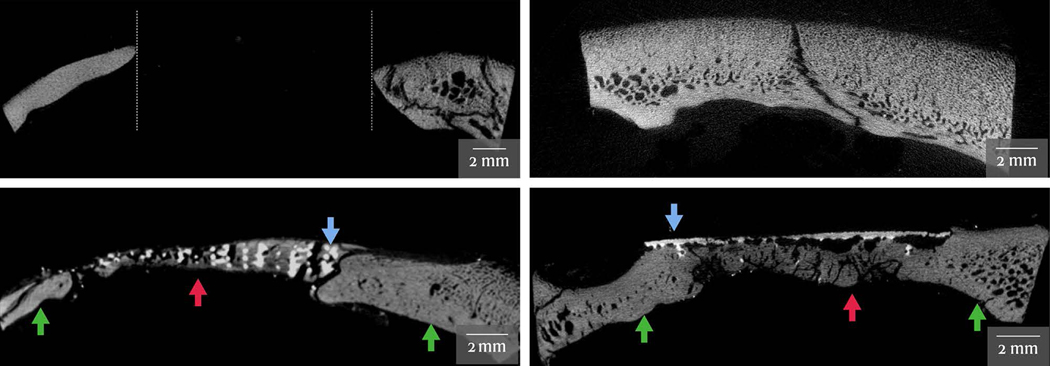
Fig. 2.
Micro–computed tomographic images of cross-section of the defect after 12 weeks of healing. (Above, left) The negative control with no bridging bone formed across the defect site (white dashed lines). (Above, right) Native bone. (Below, left) Regenerated bone (red arrow) formed across the defect site that was filled with a scaffold design that did not include a cap (blue arrow). Unoperated bone (green arrows) can be seen on either side of the defect site. (Below, right) Regenerated bone (red arrow) formed across the defect site that was filled with a scaffold design that included a cap (blue arrow). Unoperated bone (green arrows) can be seen on either side of the defect site.

