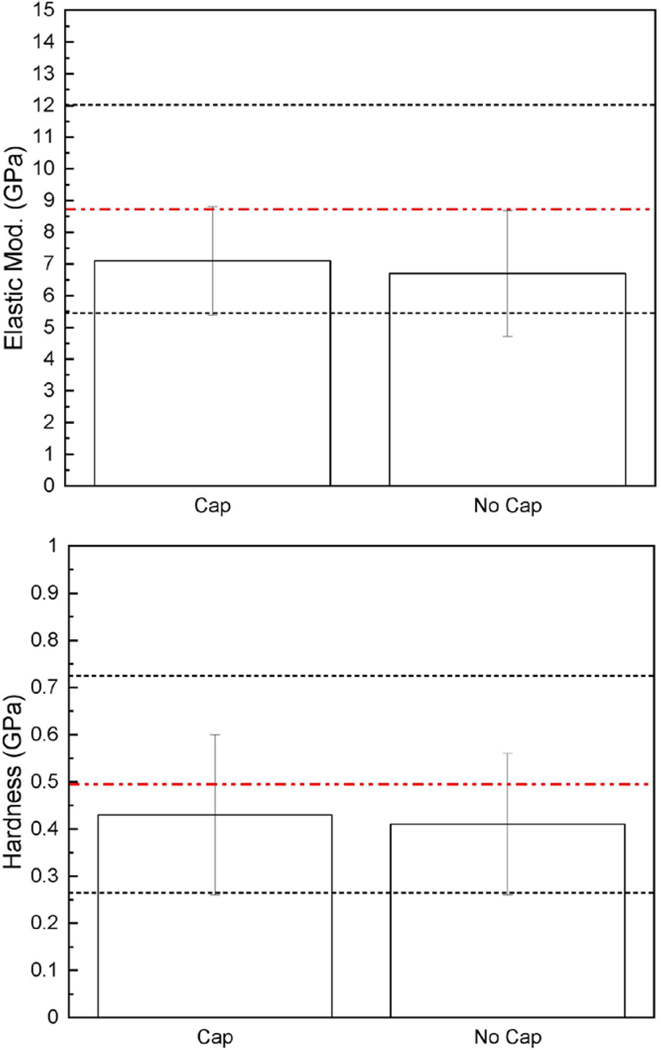
Fig. 9.
Bar graphs presenting the mean (±SD) reduced elastic modulus (above) and hardness (below) of scaffold-regenerated bone in both scaffold design groups compared with native bone (red line). The horizontal dashed red line denotes the mean with corresponding SD shown by the black horizontal lines.

