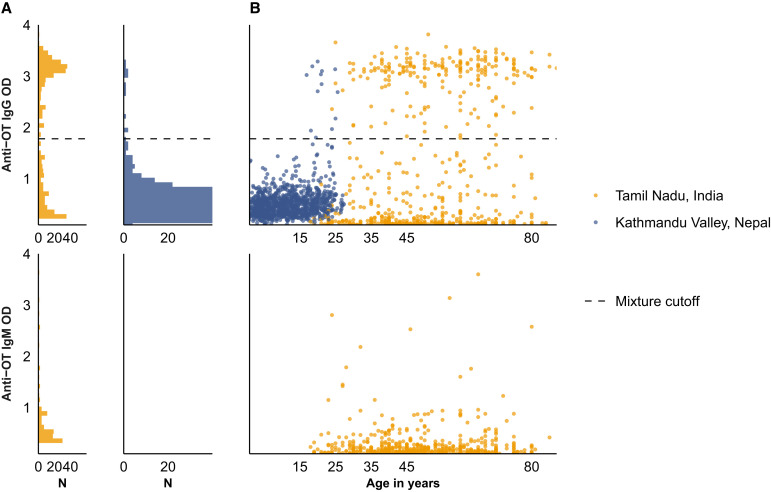
Figure 2.
Quantitative antibody responses among population serosurveys in Nepal and India. Anti-Orientia tsutsugamushi (OT) IgM and IgG responses are measured using enzyme-linked immunosorbent assays and depicted on the y axis of all plots. The horizontal dashed line denotes the mixture model cutoff. (A) Distribution of responses among the population-based samples in India and Nepal. (B) Antibody responses among the population-based samples in India and Nepal as a function of age. OD = optical density.

