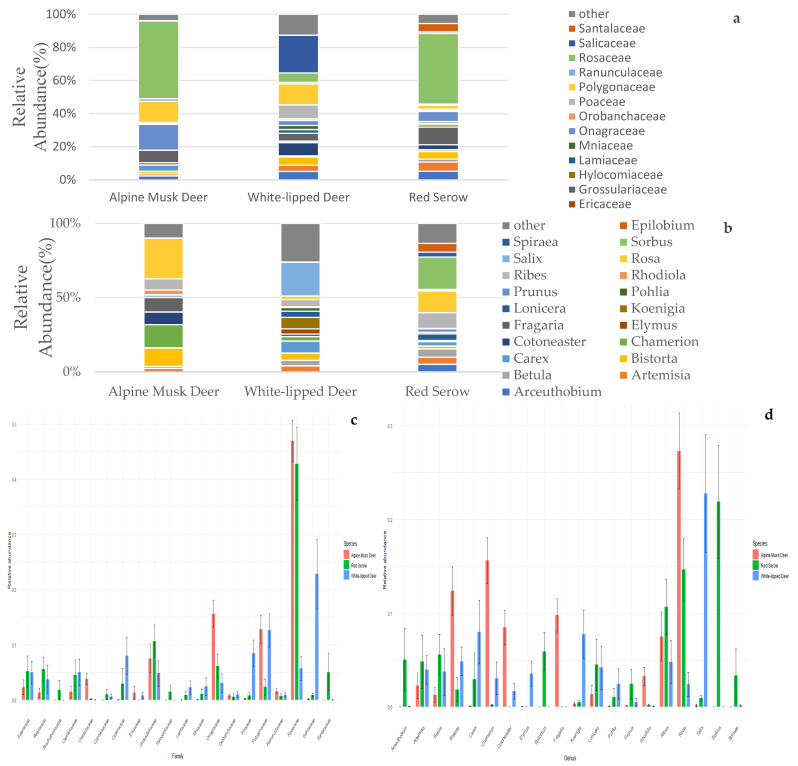
Figure 2.
(a) Stacked bar plot showing the relative abundance of food at the family level for the three animal species. (b) Stacked bar plot showing the relative abundance of food at the genus level for the three animal species. (c) Dietary relative abundance at the family level. (d) Dietary relative abundance at the genus level.

