Figure 3.
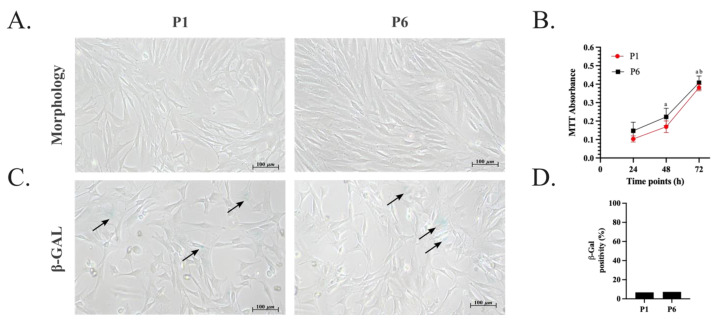
Morphology, proliferation rate, and metabolic activity of oADSCs at P1 and P6 during amplification in GM. (A) Representative phase-contrast images of oADSCs from P1 and P6 after 72 h of culture show fibroblast-like morphology. Scale bar of 100 µm. (B) The proliferation rate of oADSCs at P1 and P6 cultured for 24 h, 48 h, and 72 h was measured through MTT colorimetric assay and represented as absorbance mean values ± SD. (a vs. P1/P6 24 h, b vs. P1/P6 48 h, p < 0.05). The data for each biological sample were obtained in triplicate. (C) Metabolic activity assessment of oADSCs from P1 and P6 cultured for 48 h and observed through an inverted phase contrast microscope after β-GAL staining (blue). Scale bar of 100 µm. The black arrows indicate β-GAL positive cells. (D) The expression of β-GAL senescence assay was calculated by counting β-GAL positive cells/100 total cells obtained from three replicates for each biological sample.

