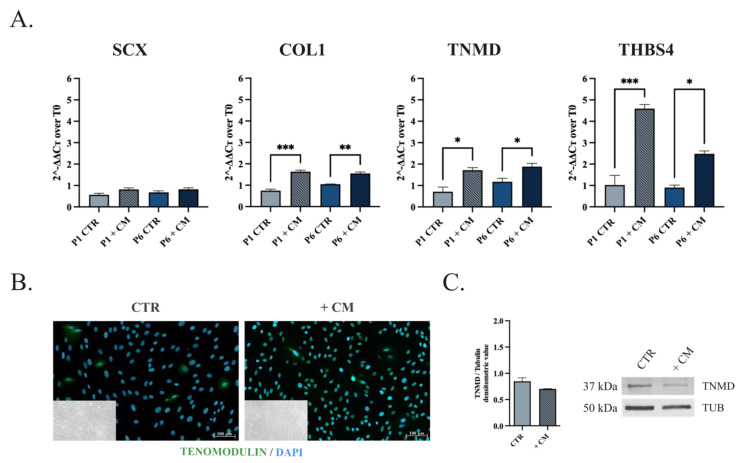
Figure 5.
Assessment of the tenogenic differentiation of oADSCs after culture with teno-inductive CM. (A) Quantitative RT-PCR evaluation of SCX, COL1, TNMD, and THBS4 tenogenic markers mRNA expression on oADSCs from P1 and P6 untreated (CTR) and treated with CM (+CM) for 14 days. (B) Representative IHC assessment of TNMD protein expression (Green fluorescence) and phase-contrast images (in the inner box) of oADSCs at P1 untreated and treated with teno-inductive CM for 14 days of culture. Nuclei were counterstained with DAPI (Blue fluorescence). Scale bar of 100 µm. (C) Representative Western blot image of α-TNMD proteins expression on oADSCs at P1 untreated (CTR), treated with CM (+CM) for 14 days, and relative densitometric values normalized on α-TUBULIN expression. Data were expressed as means ± S.D. of three replicates/each biological sample. *, **, *** Statistically significant values between the different studied groups (p < 0.05, p < 0.01, and p < 0.001, respectively).

