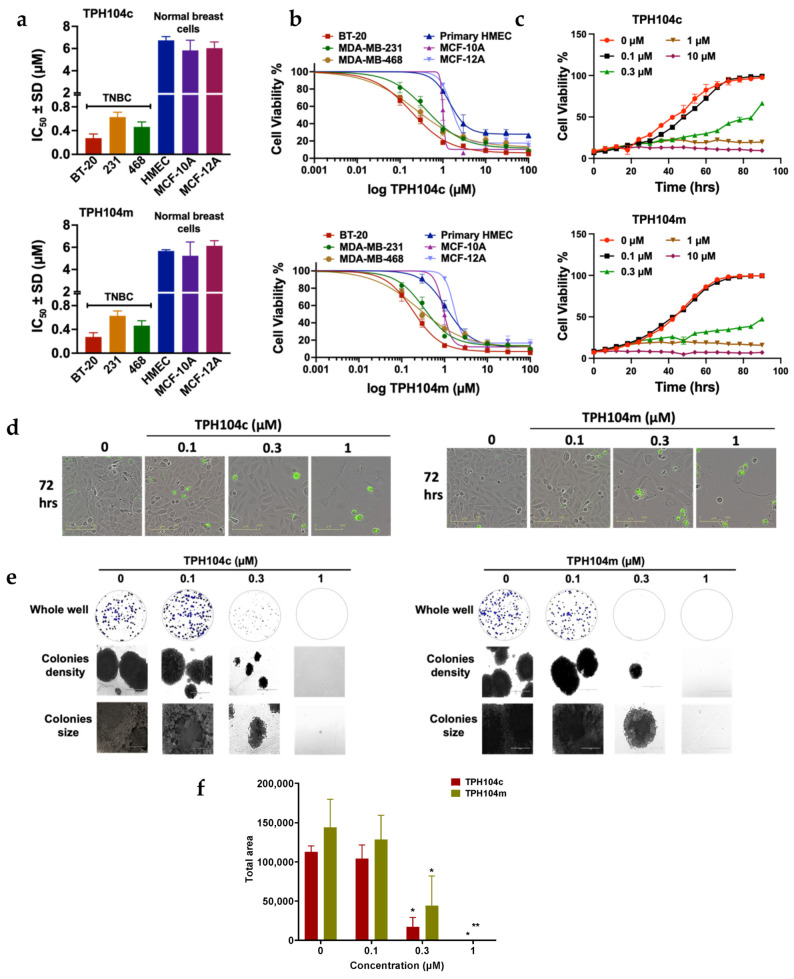
Figure 1.
The cytotoxicity (i.e., anticancer efficacy) of TPH104c and TPH104m in different breast cancer cell lines. (a) The selectivity of TPH104c and TPH104m for TNBC, compared to normal, non-TNBC cell lines and TNBC, compared to normal breast cell line. (b) The cell viability curves of BT-20 cells after incubation for 72 h, with varying concentrations of TPH104c or TPH104m, using the MTT, CTB, or SRB assays, respectively. (c) Quantitative graphs of percent (%) cell viability data obtained using IncuCyte S3 software based on phase-contrast images of BT-20 cells incubated for 72 h with vehicle or varying concentrations of TPH104c, TPH104m and media. (d) Real-time live-cell imaging pictures of BT-20 cells after incubation with TPH104c and TPH104m for 72 hrs, in an Incucyte Cytotox green reagent—containing media. The images show the green fluorescence intensity of cytotox green dye, which stains dead or non-viable cells. (e) Colony formation assay for BT-20 cells that were incubated with vehicle (0 µM), 0.1, 0.3, or 1 μM of TPH104c or TPH104m. The images show the effect of TPH104c and TPH104m on colony density and size. (f) Bar graph summarizing the effect of different concentrations of TPH104c or TPH104m on the size of the colonies formed by BT-20 cells. The results represent the mean ± SD of three independent experiments. * p < 0.05, ** p < 0.01.

