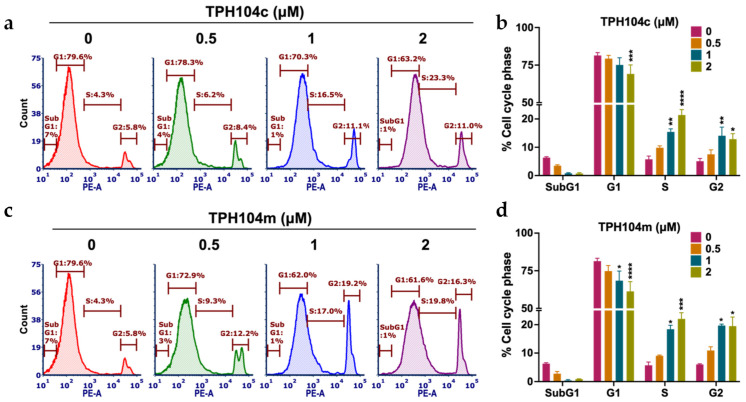
Figure 2.
The effect of TPH104c or TPH104m on the cell cycle in BT-20 cells. Representative figures showing the distribution of BT-20 cells in different phases of the cell cycle after incubation with vehicle (0 μM), (a) TPH104c, or (c) TPH104m (0.5, 1, and 2 μM). BT-20 cells were stained with PI and subjected to flow cytometry. Count (y-axis) represents the cell population used in the flow cytometric analysis, and PE-A (x-axis) represents the cells stained with PI. Quantitative histograms depicting the percent change in BT-20 cells in the SubG1, G1, S, and G2 phases of the cell cycle upon treatment with (b) TPH104c or (d) TPH104m. * p < 0.05, ** p < 0.01, *** p < 0.001, **** p < 0.0001. The data represent the average ± SD of three separate experiments performed in triplicate.

