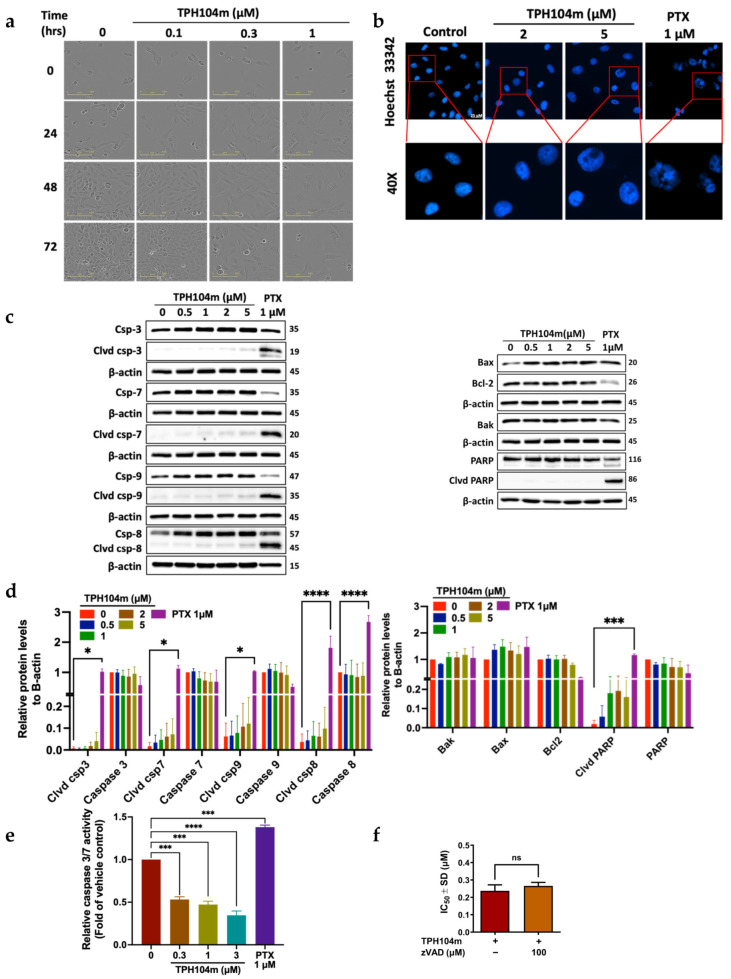
Figure 4.
The effect of TPH104c on apoptotic and anti-apoptotic proteins in BT-20 cells. (a) Representative images featuring morphological changes in BT-20 cells (20× magnification) after incubation with vehicle (media without the TPH compounds or paclitaxel (PTX)), 0.1, 0.3, or 1 μM of TPH104m, at 0, 24, 48 or 72 h post-incubation. (b) Representative images of BT-20 cells incubated with 2 or 5 μM of TPH104m or PTX (1 μM,) a positive control) or vehicle control and stained with Hoechst 33342 dye. TPH104c did not produce condensed or fragmented nuclei, compared to cells incubated with PTX. Scale bar = 25 μM. (c) Western blot images for the apoptotic molecules, cleaved caspase-3, caspase-3, cleaved caspase-7, caspase-7, cleaved caspase-9, caspase-9, cleaved caspase-8, caspase-8, BAX, BAK, BCL-2, cleaved PARP, and PARP, following incubation with vehicle (0 µM), 0.5, 1, 2, or 5 μM of TPH104m. The data are expressed as the ratio to β-actin, followed by normalization to the vehicle control. (d) The level of each protein is shown by histograms. Clvd = cleaved; Csp = caspase. The data represent the average ± SEM of four separate studies. (e) Caspase-Glo 3/7 assay results are presented as a bar graph and as a curve, showing that incubation of BT-20 cells with TPH104m for 24 h decreased the levels of caspase 3/7 in a concentration-dependent manner. In contrast, PTX (1 μM) increased the levels of caspase 3 and 7 (n = 2). (f) IC50 values, using the MTT assay, for TPH104c in BT-20 cells that were preincubated with z-VADfmk and then incubated with varying concentrations of TPH104c for 72 h. The data is obtained from three independent experiments conducted in triplicates and represents the average ± SD. * p < 0.05, *** p < 0.001, **** p < 0.0001 and ns means non-significant. Original Western Blot images can be found in Supplementary Materials.

