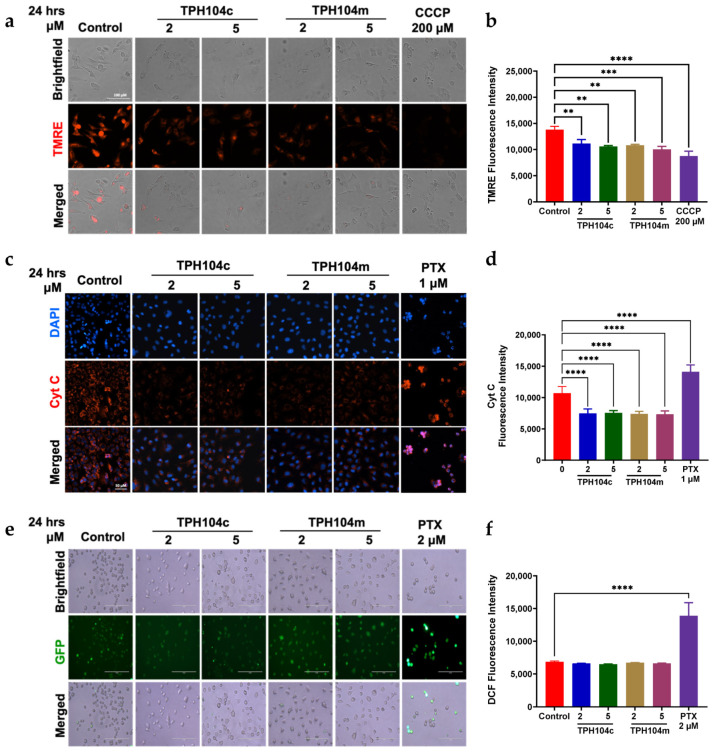
Figure 5.
TPH104c and TPH104m induced the loss of the mitochondrial membrane potential but did not induce oxidative stress in BT-20 cells. (a) Fluorescent microscopic images of BT-20 cells stained with TMRE dye after incubation with the vehicle for 24 h (0 μM), 2 or 5 μM of TPH104c or TPH104m, and CCCP as a positive control. The TMRE dye is retained in cells with normal structural and functioning mitochondria, producing a high level of red fluorescence, whereas weak or no fluorescence occurred in cells without MMP. Scale bar = 200 µm. (b) Quantitative bar graph illustrating the change in the percentage of red fluorescence in BT-20 cells incubated with 2, or 5 µM of TPH104c and TPH104m or CCCP, compared to cells incubated with media. The results are shown as mean ± SD in triplicate. CCCP = Carbonyl cyanide 3-chlorophenylhydrazone. (c) Immunofluorescence analysis of cytochrome c levels in BT-20 cells incubated with 2 or 5 μM of TPH104c or TPH104m or PTX or vehicle control (0 μM), for 24 h. PTX = Paclitaxel. Scale bar = 50 µm. (d) Bar graphs illustrating the fluorescence intensity of cytochrome c in BT-20 cells incubated with 2 and 5 µM TPH104c and TPH104m or vehicle control (0 μM) for 24 h. (e) Representative images and (f) bar graphs depicting the level of dichlorofluorescein (DCF) fluorescence in BT-20 cells incubated with TPH104c and TPH104m (0 μM (vehicle), 2, or 5 μM) for 24 h, or paclitaxel (2 μM) for 2 h. Images were captured at 20× magnification. Scale bar = 200 µm. Relative fluorescence units of H2DCFA in BT-20 cells. The data are expressed as the average fluorescence ± SEM of three separate experiments. ** p < 0.01, *** p < 0.001, **** p < 0.0001, compared to the vehicle control cells.

