Figure 6.
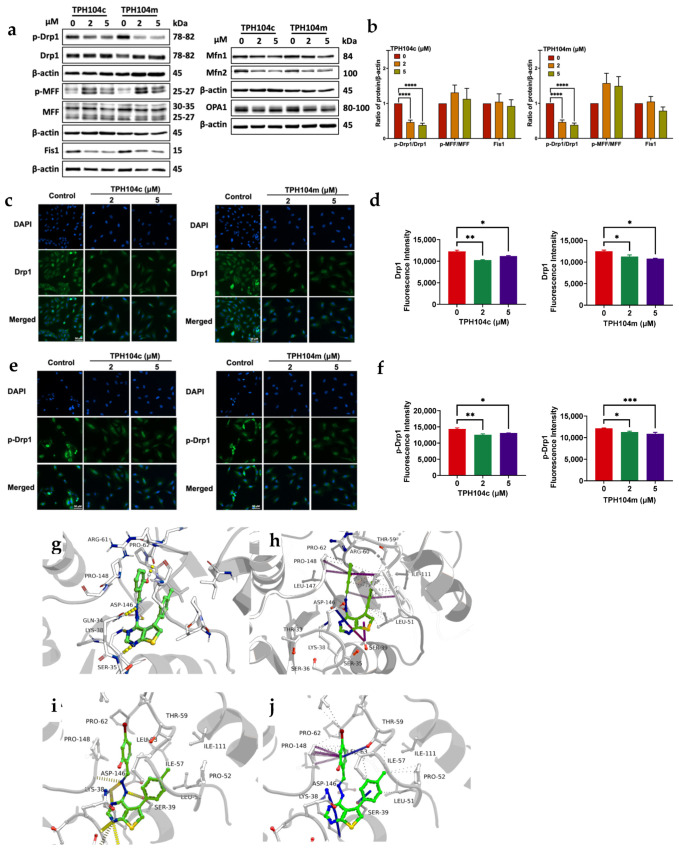
The effect of TPH104c and TPH104m on the levels of mitochondrial proteins, DRP1 and phosphorylated DRP1 (p-DRP1). (a) Western blot images for the mitochondrial fission proteins, p-DRP1, DRP1, p-MFF, MFF, and Fis1, and the mitochondrial fusion proteins, MFN1, MFN2, or OPA1, following incubation with vehicle (0 μM), 2, or 5 μM of TPH104c and TPH104m. All proteins were expressed as a ratio to β-actin, followed by normalization to the vehicle control. (b) Histograms showing the ratio of phosphorylated proteins to total proteins and individual proteins. All data are presented as the mean ± SEM of 4-5 independent studies. Immunofluorescence analysis of DRP1 (c) and p-DRP1 (e) at Serine 616C in BT-20 cells incubated for 24 h with vehicle (0 μM), 2, or 5 μM of TPH104c or TPH104m. Bar graphs showing the quantification of the fluorescence intensity of DRP1 (d) and p-DRP1 (f). Scale bar = 50 µm. * p < 0.05, ** p < 0.01, *** p < 0.001, **** p < 0.0001. Predicted non-covalent interactions of ligands TPH104c and TPH104m. (g) Hydrogen bonds (yellow) shared between TPH104c and DRP-1; (h) Carbon-π and donor-π interactions between TPH104c and DRP-1 (i) Hydrogen bonds (yellow) shared between TPH104m and DRP-1; (j) Carbon-π and donor-π interactions between TPH104m and DRP1. Representative graphs obtained from a Nicoya SPR assay, where a direct drug-protein binding interaction occurred between the Drp1 recombinant protein and varying concentrations of (k) TPH104c (l) TPH104m. Results are shown as the mean ± SD of triplicate experiments. Original Western Blot images can be found in Supplementary Materials.


