Figure 7.
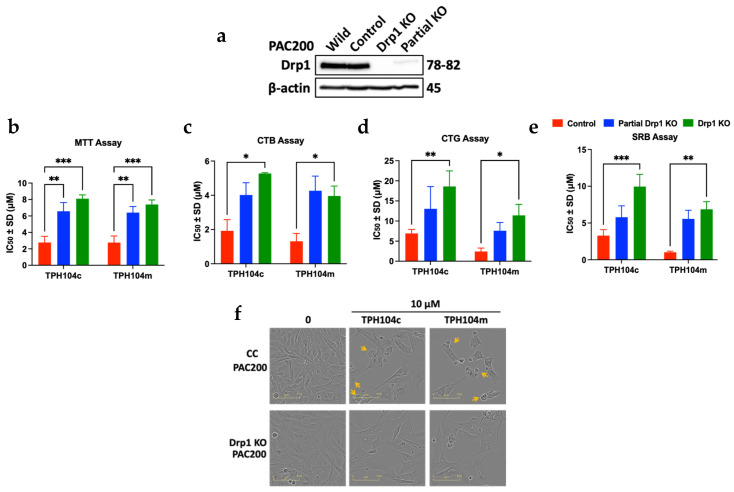
The cytotoxic efficacy of TPH104c and TPH104m on CRISPR (wild-type control) and partial and complete DRP1 knockout (KO) PAC200 cells. (a) Western blot images of DRP1 levels in CRISPR wild-type (control) PAC200 cells PAC200 and complete and partial DRP1 KO cells. Bar graphs depicting the IC50 values of TPH104c and TPH104m in CRISPR wild-type, partial DRP1 KO, and complete DRP1 KO PAC200 cells after 72 h of incubation, calculated using (b) MTT assay, (c) CTB assay, (d) CTG assay, and (e) SRB assay. (f) Morphological images of CRISPR wild-type and complete DRP1 KO PAC200 cells incubated with 10 μM of TPH104c and TPH104m, for 72 h. Yellow arrows represent a bubble-like formation that indicates bursting. Scale bar, 100 µm. * p < 0.05, ** p < 0.01, *** p < 0.001. Original Western Blot images can be found in Supplementary Materials.

