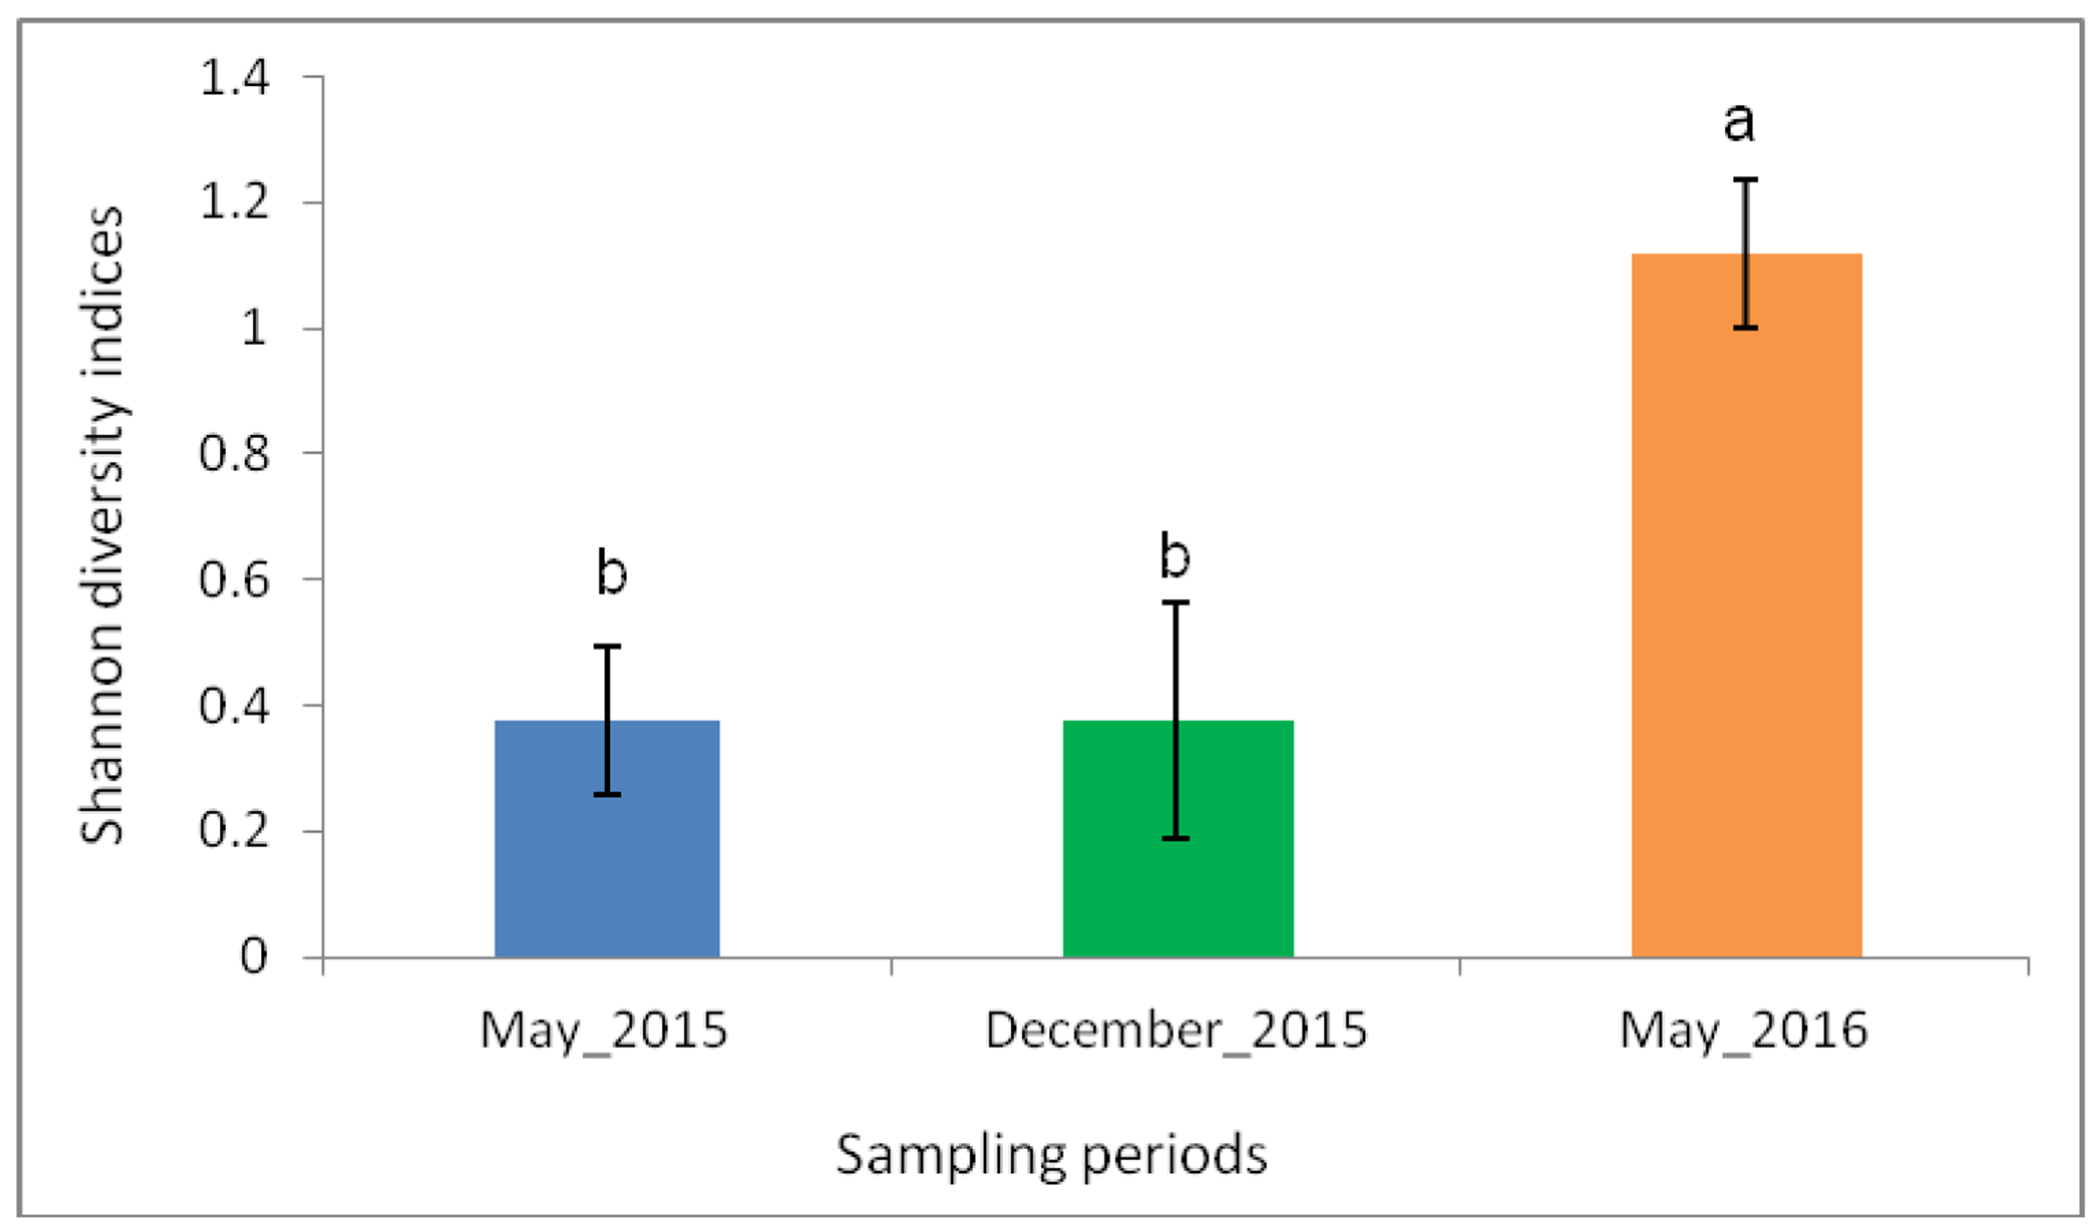
Figure 2:

Shannon diversity indices across the three sampling periods. There was significantly high species diversity during the May 2016 sampling period. Error bars denote the standard error. Bars followed by different letters denote significant difference.
