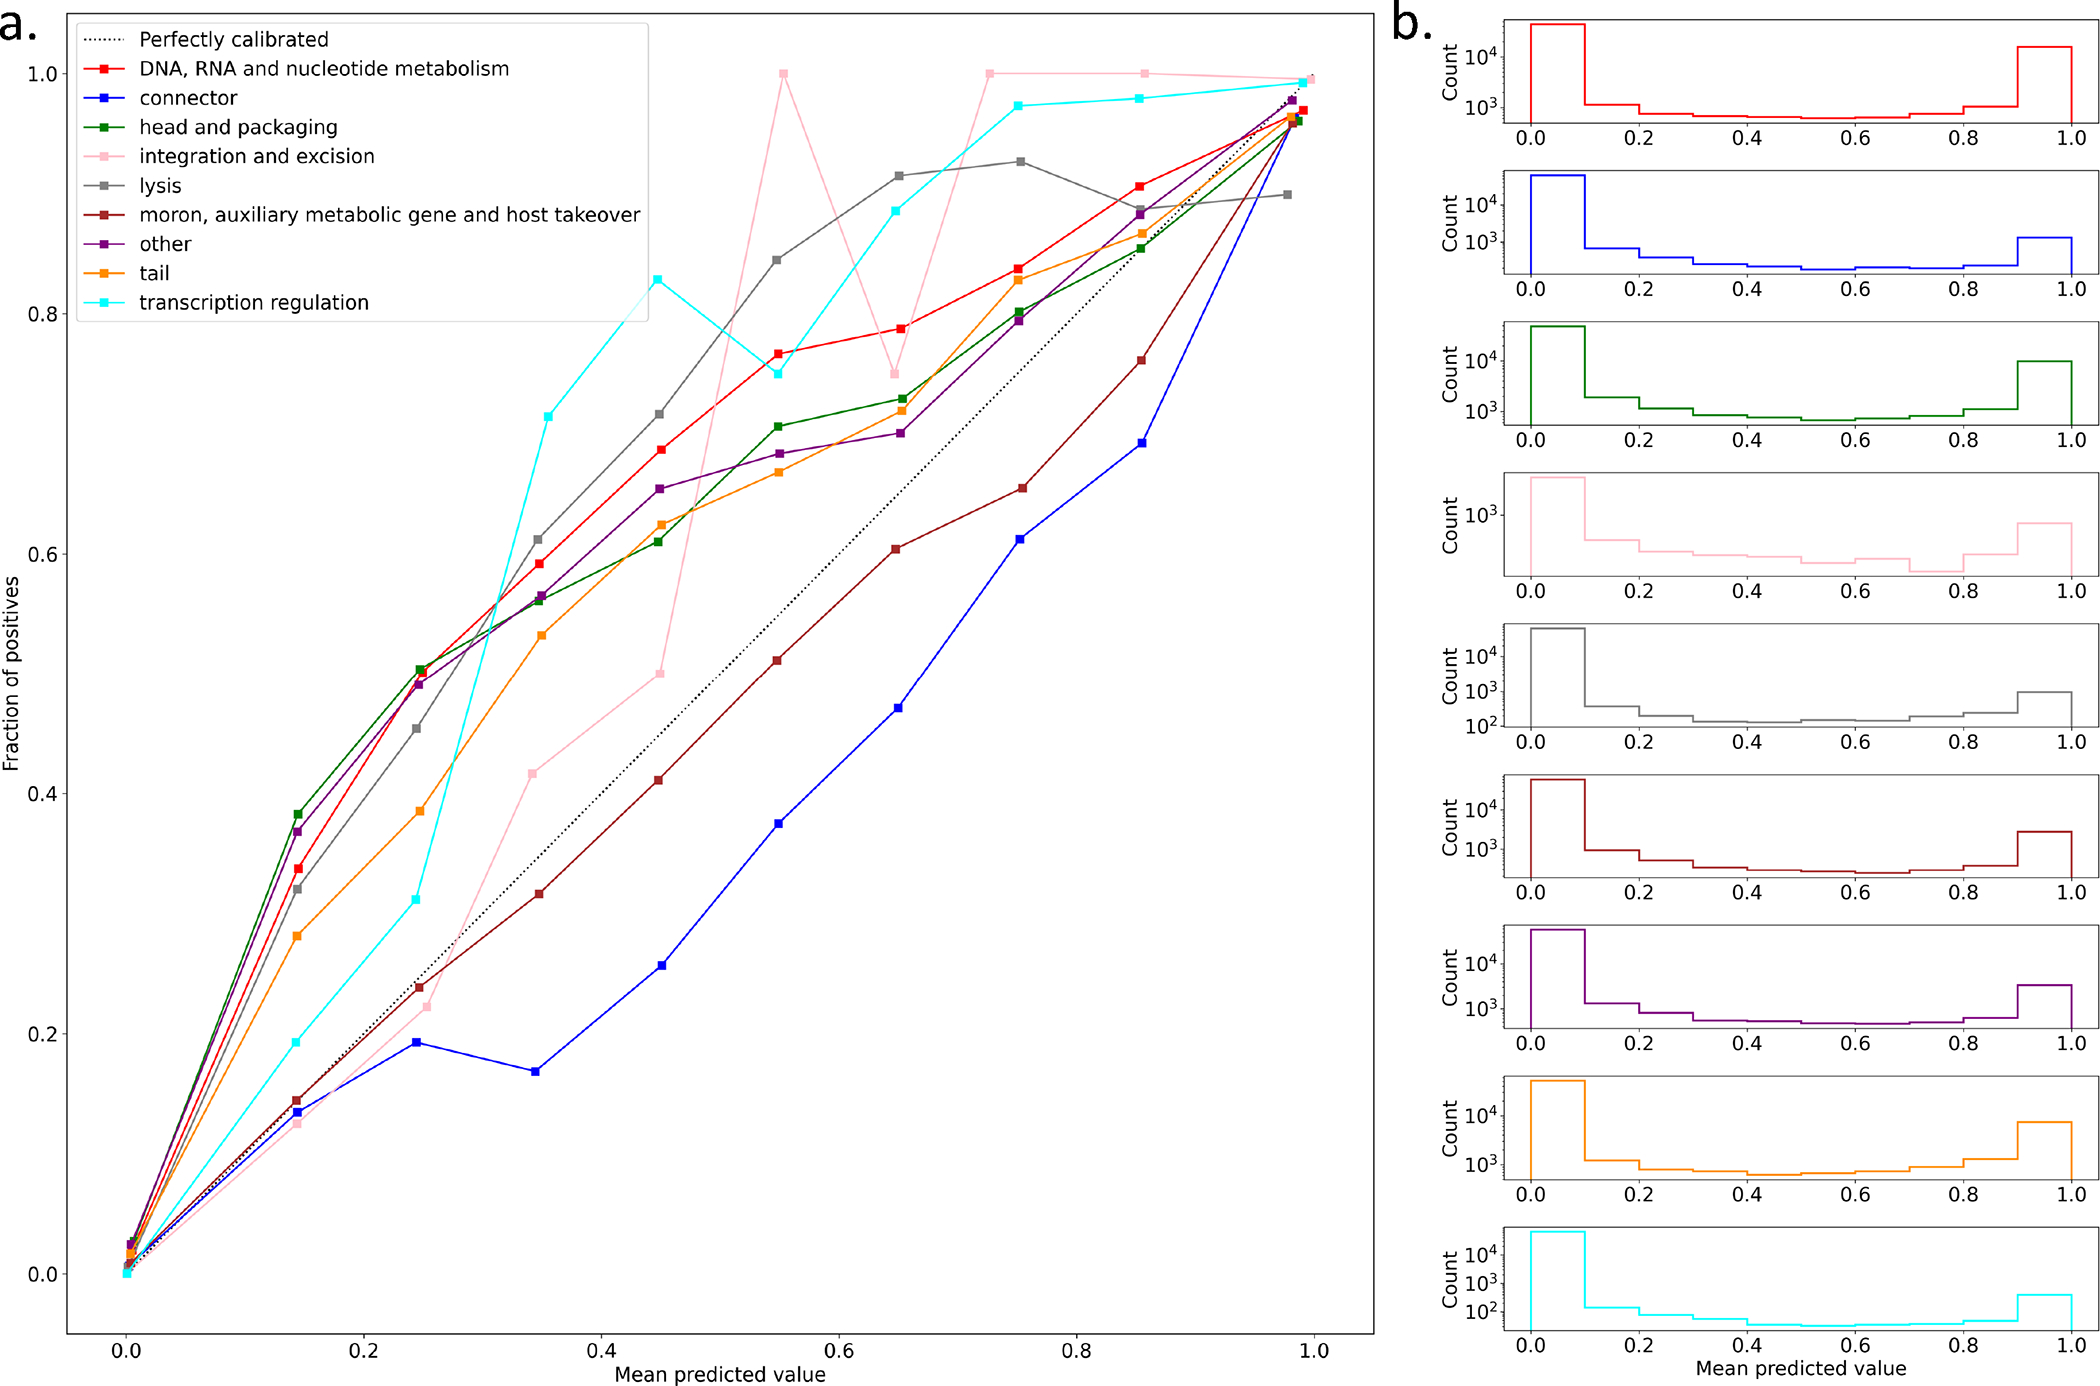
Extended Data Figure 4: EFAM function classifier calibration analysis.

(a) EFAM VPFs that have hits to annotated PHROG HMMs (test set) are used to evaluate the model calibration for each category. For each class, probabilities across all VPFs in the test set are binned into 10 partitions and the fraction of true positives for each bin is calculated. A perfectly calibrated model (dotted line) has a true positive proportion equal to the mean predicted probability for each bin. Below the perfect model indicates overconfidence and under the perfect model indicates under confidence. (b) Histogram of the number of predictions across the test set for each probability bin.
