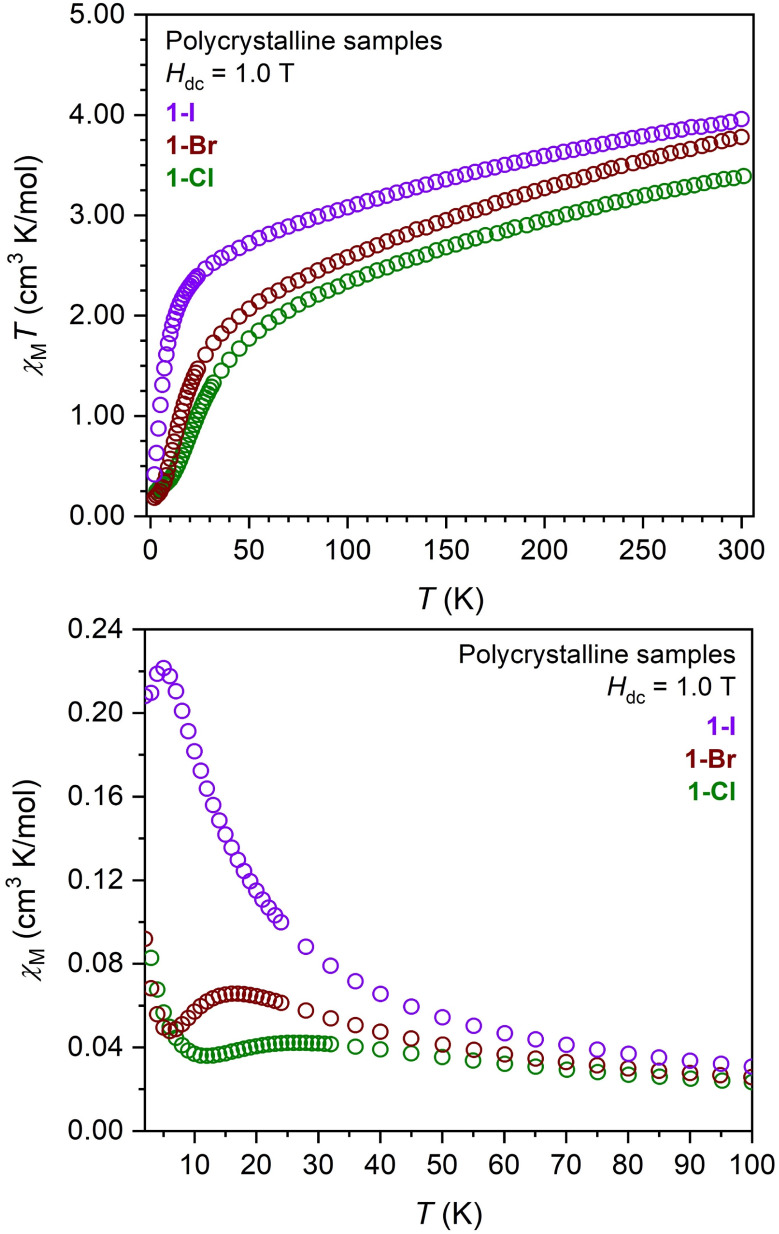
Figure 4.

Plots of the molar magnetic susceptibility times temperature (χMT, upper) and molar magnetic susceptibility (χM, lower) versus temperature for polycrystalline samples of (CpiPr5)3U3X6 (1-X, X = Cl, Br, I) under a dc field of 1.0 T. The maxima in χM versus T at 28, 17, and 5 K, respectively, for 1-Cl, 1-Br, and 1-I are indicative of antiferromagnetic exchange interactions as discussed in the text. The subsequent increase in χM below these maxima as the temperature approaches 2 K likely originates from the presence of a minor paramagnetic impurity.47,55,85
