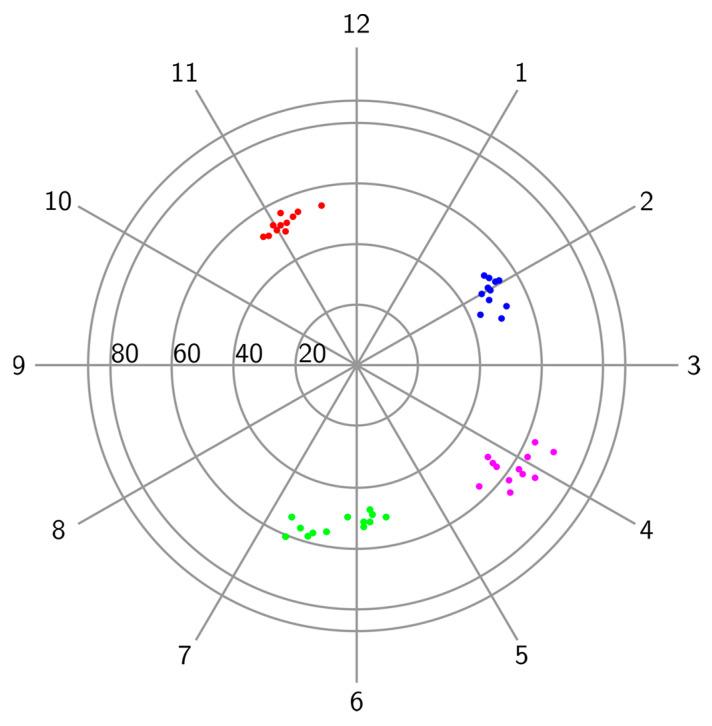
Figure 6.
The distribution of mass displacements across four subjects, one in each quadrant, is illustrated using clock face positions (hours) and distances to the nipple (mm). The colored dots on the figure represent the positions of four masses across repeated recordings. The dots with the same color represent the positions of the same mass.

